

PE: Global Resources Allocation Change behind Import Shrinkage
For a long time, China’s PE import dependence degree has been above 40%, and imported PE has become the main component of China’s domestic market. However, in 2021, the total PE imports took a historic turn, with the growth rate turning from positive to negative. In addition, the downward trend of the PE import volume seems hard to reverse in 2022. Compared with previous years, the global PE market has seen more obvious changes in terms of capacity layout and changes in the price spread between internal and external markets. Under the background of high costs and weakened demand, the operation of players is under pressure. Besides, the changes in freight, transportation capacity and container supply as well as geopolitical factors promoted the global PE resources flow more flexibly than that in previous years.
Import shrinkage on account of changes in the macro environment
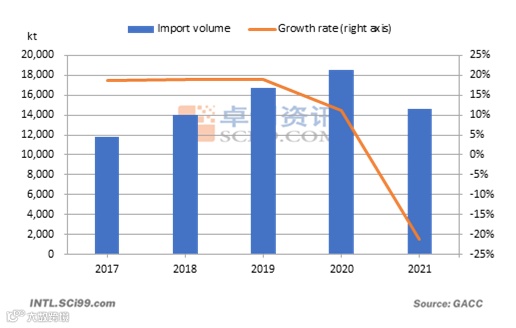
From 2017 to 2020, China’s PE import volume increased year by year, rising from 11,793.1kt to about 18,533.5kt. In 2020, China’s PE import volume increased by 11.18%, reaching a historical high. It was mainly affected by the force majeure events in the overseas market. On the one hand, the operating rate at foreign plants continued to decline, and the demand was weak. Demand in China’s domestic market recovered first, so foreign producers turned the export target to the Chinese market and quoted low prices. Buyers in China actively hunted for the bottom and bought a large amount of pre-sale resources. In 2021, China’s import volume dropped sharply. China’s PE import volume totaled 14,588.7kt in 2021, down 21.28% Y-O-Y. What are the changes in the influencing factors behind the import shrinkage?
Factor 1: Higher import prices weakened the buying sentiment in China’s domestic market
From 2016 to 2018, the mainstream imported LLDPE prices were mostly higher than China’s domestic prices. There were two reasons for this. First, China’s prices focused on the coal chemical resources whose prices were relatively low, while the import price reflected the prices of those medium-level imported resources. The price spread between those two kinds of resources was RMB 200-300/mt. Second, the pricing of overseas dealers had been slow to respond to the market changes during 2016-2018. Thus, the international prices were lower than the domestic prices. From 2019 to 2020, the mainstream imported LLDPE prices were mostly lower than the domestic prices. There were two reasons for this. First, as the market competition became fiercer, the overseas dealers’ pricing policies became more flexible. Even the prices of medium-level imported resources were lower than the domestic prices by RMB 0-400/mt. Second, the foreign PE market was under pressure affected by the pandemic, so the demand was sluggish. Foreign suppliers have concentrated on selling the products at low prices to China, where demand was recovering quickly.

Chart 1 2017-2021 LLDPE RMB and USD Price Spread
In 2021, the import price of LLDPE became higher than China’s LLDPE price again. First, foreign suppliers reduced their offers to China due to the lower price, and the import price was high due to the limited tradeable resources. Second, China’s new capacity came on stream intensively. The supply was ample with units going into production at Ningbo Huatai Shengfu Polymeric Material, Lianyungang Petrochemical, Heilongjiang Hiaguo Longyou Petrochemical, etc. In 2021, the largest price spread between China-origin and imported resources appeared in late March when the international price was higher than the domestic price by about RMB 800-1,000/mt. That was because the global supply tapered down due to the extreme cold weather in Northeast America and intensive maintenance in the Middle East, while the performance of the Chinese market was flat.
Factor 2: China’s PE capacity expended quickly

Chart 2 2017-2021 China PE Capacity, Output and Operating Rate
By 2022, China’s PE capacity is expected to reach 31,208kt/a, up 4,600kt/a Y-O-Y. From 2017 to 2019, the capacity growth rate was in the range of 5%-7%. From 2020 to 2022, the capacity growth rate was in the range of 17.29%-18.36%. Therein, the capacity growth rate in 2020 reached a five-year high of 18.36%, benefiting from the intensive commissioning of large refining and chemical projects.
The capacity expansion pushed up the output quickly. In 2018, the output growth was low, which was 1.92%. From 2019 to 2022, the output growth rate exceeded 10%. Therein, China's PE output was 22,898.4kt, up 12.68% Y-O-Y. In 2022, China’s PE output is predicted to be 25,430kt, up 11.06%. The growth rate in 2022 is estimated to drop. The reasons are as follows: Under the background of high crude oil price and low demand, the cost transmission was hindered, dampening the production enthusiasm of producers. In H1, 2022, producers conducted maintenance or lowered the operating rate intensively, putting a damper on the output increase. However, given the quick capacity expansion in China, the output will keep going up.

Chart 3 2017-2021 China PE Apparent Consumption Volume
From 2017 to 2021, China’s apparent consumption volume of PE first rose and then declined, with a CAGR of 8.88%. The high growth rate of consumption backed up the market sentiment. China became the largest PE consumer in the world. However, the overall consumption in 2021 underperformed, and the overall consumption volume was 36,975.9kt, down 4.21% Y-O-Y. Reasons: In response to the industry adjustment, some downstream producers suspended production or lowered the operating load. In the meantime, the processing activity in the overseas market increased. In addition, the freight went up, and the container was in short supply, so the orders to China went down. Both the demand in China’s domestic market and the overseas market went down, dampening the demand for feedstock.
Overall, China-origin supply increased, filling the gap of import decline. The order at downstream plants was not sufficient, further weakening the demand for imported resources.
Factor 3: Operating rate of overseas units was low due to unexpected factors and high cost
It was found that the global PE industry operating rate was low from 2020 to 2021, as the maintenance increased due to the overseas force majeure events and the extreme weather. In 2020, the operating rate dropped from February to April, due to the force majeure event and the unexpected shutdown of units, especially in India, Europe, etc. The lowest operating rate dropped to 30% or so. In 2021, affected by the cold weather in February, the lower temperature led to a power supply shortage. PE units at Chevron Phillips, Formosa, Equistar, ExxonMobil, Dow, Inoes, etc. went offline provisionally. In the meantime, producers in the Middle East such as KAYAN and Sadara conducted maintenance intensively, so the operating rate dropped accordingly. The low operating rate in the overseas market weakened the supply. In addition, the USD prices were higher, which further dampened the willingness of foreign traders to allocate goods to the Chinese market.
In Q1,2022, the maintenance was concentrated in Asia. In Asia, the crackers in South Korea and Japan were in the maintenance season. In addition, some units in Northeast Asia and Southeast Asia ran at reduced operating rates. The operating rate of downstream PE units was lowered again. In Europe, due to soaring crude oil and natural gas prices, petrochemical companies have poor profits, and there are also load reductions and shutdowns. The overall supply pressure was lower than expected.
Overall, there were three main reasons behind China’s PE import shrinkage. First, some resources from the Middle East flowed to Europe, the U.S. and Southeast Asia where the prices were higher. Second, with China’s newly added units going into production, China-origin supply increased accordingly. Some low-priced resources impacted the market. Third, the issue of global rising freight and container shortage, port congestion and curbed transportation capacity also impacted global resources allocation.
All information provided by SCI is for reference only, which shall not be reproduced without permission.
Please click "Read more" for the full article.
