

History Recurrence: Comparison of Tissue Market Drivers in 2018 and 2023
Intro: The tissue market trend from 2020 to 2022 was generally in line with that from 2016 to 2017, but the fluctuation and more volatile. In 2023, the tissue market has entered a downward channel, which shows a certain resemblance to the situation in 2018. However, there are also clear monthly differences.
Tissue price trend from 2020 to 2022 was basically in line with that from 2016 to 2017, and the fluctuation was more volatile
From 2016 to 2017, the wood pulp tissue market price showed a W-shaped tren, and it started to head down in 2018. A similar trend was observed from 2020 to 2022, and the fluctuation was more volatile.
The previous tissue market cycle started in September 2016, and by November 2017, the tissue price reached a high level of RMB 8,100/mt, which was RMB 1,950/mt higher than that in 2016, which was RMB 6,150/mt.
The bullish cycle from 2020 to 2022 started in November 2020, and by November 2022, the tissue price rose to RMB 8,150/mt, which was RMB 2,950/mt higher than the low level of RMB 5,200/mt.

As seen from the chart above, tissue prices in early 2018 and early 2023 were both at historic highs. The similarities and differences between the two price peaks will be demonstrated by analyzing key price drivers.
Price trend during the first two months of 2018 and 2023 differed slightly.
The wood pulp tissue market trends in 2018 and 2023 both head down, but there are some short-term differences.
Against the backdrop of global economic and trade deceleration and rising uncertainties and challenges, China has maintained a decent economic growth rate. In 2018, the wood pulp tissue average market price rose by 8.23% Y-O-Y. The market trend during the first two months generally headed down, and the tissue price dropped by 3.09% M-O-M from RMB 8,100/mt to 7,850/mt mainly due to the high tissue operating rate.
In 2023, the tissue market trend was relatively firm. Some players lowered prices to facilitate sales, but most tissue mills went under maintenance during the Spring festival holiday, and the industry operating rate fell to 50%. In addition to the restocking cycle after the holiday, the tissue market saw minor fluctuations. As of mid-February, the wood pulp tissue average price only saw a minor fluctuation of 0.33%.

The tissue market trend in 2023 shows similarity with that in 2018, but there are clear monthly differences
2018 and 2023 Key Market Driver Comparison
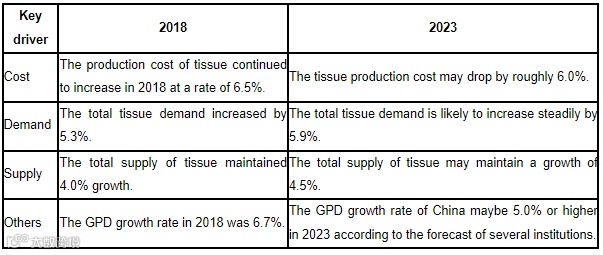
Cost: In 2023, with the release of market pulp capacity overseas and rising pulp supply in China, the tissue production cost may drop, which differs from the situation in 2018. During H1 of 2023, the production cost may trend down, but it may rebound marginally in H2 at a narrower rate than that in 2018.
Demand: With the economic recovery in China, tissue demand may grow steadily in 2023. Besides, as the influence of the force majeure factor fades, several institutions demonstrate positive expectations of the Chinese economy. Thus, SCI estimates that the tissue demand growth may be around 5.9%, which is slightly higher than that in 2018.
Supply: Due to abundant pulp market supply in 2023 and the constant release of newly added tissue capacity, SCI estimates that the total tissue supply growth will be 4.5%, which is higher than that in 2018.
In conclusion, the tissue market trend in 2023 shares some similarities with that in 2018, but there are clear monthly differences. During Q1 of 2023, the tissue production costs remain high, and the profit rate of tissue mills is relatively low. The tissue price remains range-bound backed by downstream restocking around the Spring Festival holiday, which differs from that in 2018.
From April to July, due to falling pulp prices and the market demand slack season, the tissue price is expected to drop, which is in line with that in 2018.
In August, SCI estimates that the tissue price may rebound slightly as H2 promotional activities start. The trend may be similar to that in 2018, but the rebound may be smaller.
In 2023, the highest tissue price may appear in February, while the lowest may appear in June or July. The general market trend will be heading down, which differs slightly from that in 2018.
All information provided by SCI is for reference only, which shall not be reproduced without permission.
Please click "Read more" for the full article.
