

Macro Semi Annual Report: Navigating Complexity, Hidden Signals in the Macro Landscape
[Introduction] In the first half of the year, SCI observed dual macro pricing processes—the post-pandemic recovery that spiked commodity prices, followed by the cyclical realignment that led to the subsequent drop. Post-June, the market prices improved gradually, and market sentiments began to return to normal. Considering cyclical factors, the directional pricing of commodities is nearly complete. Towards the second half of the year, it is expected that price variance will be influenced primarily by the intrinsic fundamentals of individual commodities.
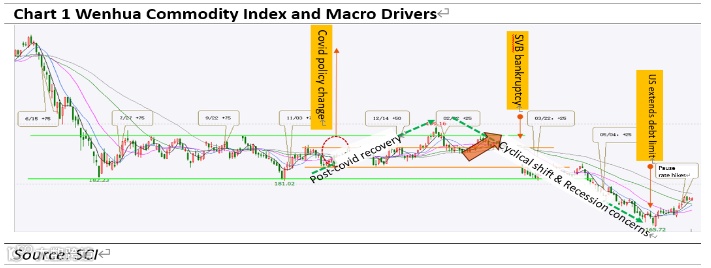
In the past six months, commodity prices, as indicated by Wenhua CCI, saw an initial upswing followed by a marked decline. The upswing, which began in October 2022 and lasted until the end of January 2023 following the Chinese New Year, was predominantly fueled by escalating market expectations, stimulated by the refinement of COVID containment policies. Nonetheless, following a short-lived false breakthrough, prices reverted to a period of fluctuation and subsequently reached their trough of the fluctuation range during the traditional peak demand season of March and April. By late April, prices had not only descended below the fluctuation range but also embarked on a steep downward trajectory, finally bottoming out at the close of May.
Utilizing the SCI Commodity Producer Price Index as a reference, on June 27th, the index closed at 104.35 points, with the Industrial Goods Index at 103.60 points and the Agricultural Products Index at 106.09 points. Relative to the outset of the year, these figures denoted declines of 11.91, 14.58, and 5.85 points correspondingly, or percentage drops of 10.25%, 12.34%, and 5.22% respectively. This scenario underscored the pervasive trend of declining prices.

Analyzing the month-on-month price trends since the commencement of 2022, a general upward trajectory in commodity prices was initially observed, followed by a decline. Although prices held stable in Q1, a substantial downturn was observed in April and May, representing a distinct anomaly when compared to typical seasonally-adjusted expectations. In addition, agricultural products and industrial goods prices took slightly divergent paths: Industrial product prices persisted in their downward trend initiated post-October 2021, while agricultural products extended a decline that commenced in October 2022. On a year-on-year basis, a concurrent downward trend occurred in both SCI's Agricultural Products and Industrial Goods Indices. This corresponded with a concurrent decrease in the PPI-CPI as indicated by the macroeconomic data.
Upon evaluating the market price trends of key production materials in the circulation domain, based on an analysis of 50 monitored items as of June 27, only 8 items—copper, polyester filament, gasoline, diesel, paraffin, glass, cotton, and rice—experienced a price increase relative to the start of the year, while the remaining 42 observed a decline. Notably, of those experiencing a drop, 23 out of the 42 items recorded a fall exceeding 10%, with Glyphosate witnessing the most pronounced decrease at a substantial 50%. The majority of items with reductions of over 30% were associated with the energy sector, underscoring the diminishing impact of supply shocks on the market.
Ultimately, commodity prices are the result of the tug-of-war between present conditions and future expectations, underpinned by shifts in supply-demand dynamics.
From the perspective of price movements, present conditions versus future expectations in fundamentals have been the main drivers behind the pivot from a price increase to a decline in 2023.
1) The post-pandemic recovery that spiked commodity prices, followed by the cyclical realignment that led to the subsequent drop. In 2022, stimulated by the refinement of COVID containment policies, the market transitioned into a recovery phase, fostering buoyant expectations for a robust economic revival in China. Consequently, underpinned by market participants’ growing purchasing interest, this upbeat sentiment fueled a bullish trend in both commodity and equity asset prices, a momentum that sustained beyond the Chinese New Year celebrations. However, in the aftermath of the festival, as participants started to realize that the demand recovery was not as vibrant as initially anticipated, and coupled with the ripple effects of Silicon Valley Bank's bankruptcy, expectations pivoted towards an impending recession. This shift in market sentiment instigated a gradual depreciation in prices that endured through the end of May.
2) Amidst heightened recovery expectations, the actions of upstream and downstream market participants emerged as the pivotal influencers of price trends. As evidenced by SCI data, the rebound in industrial productivity around the 2023 Chinese New Year considerably outstripped past years' performances. This underscores the steadfast confidence of the upstream sector in a robust recovery, catalyzing a notable escalation in output. Noteworthy instances include the processing volume of crude oil and the production of major petrochemical derivatives, which all reached unprecedented peaks, as did crude steel output in the first half of the year. Yet, despite all-time high supply, demand recovery remained sluggish. Given the juxtaposition of abundant supply and subdued demand, coupled with unfavorable macroeconomic news, prices embarked on an accelerated downturn during the traditional peak demand season spanning March and April.
3) The market was characterized by subdued demand, underscored by a significant divergence in recovery pace between domestic and international markets. In 2023, the course of global demand starkly deviated from historical patterns, with inherent momentum demonstrating a marked resurgence from a prior low base. But even under the same demand landscape, the fundamental drivers differed greatly between markets. For example, markets like crude oil and natural gas witnessed a clearance of risk premiums from previous supply conditions, while ferrous and non-ferrous metals were thwarted by the domestic demand recovery which was below expectations, and some other markets such as coal were affected by both. In contrast, certain agricultural products with weak macro-cyclical correlations, including sugar and cotton, continued to uphold high prices, primarily capitalizing on the supply risk premiums. Conversely, gold derived its principal advantage from speculative front-running trades and unpredictable risk events.
Prices of international and domestic commodities were on a downward trend. Commodities with significant dependency on foreign markets, such as crude oil, iron ore, copper, nickel, and soybeans, are highly responsive to international price fluctuations and experienced a downturn. Even commodities with limited dependency on foreign markets, such as coal, have registered price declines due to demand falling short of expectations as well as domestic supply assurance policies which maintained adequate availability. Notably, commodities such as sugar and cotton are markedly influenced by supply disruptions, while the value of gold primarily affected by its attribute as a safety asset.
From the perspective of price movements, exceptionally severe fluctuations in commodity prices are linked to an expectation gap and trading sentiments.
1) Bullish expectations gave way to sobering reality, resulting in a downward price shift. Early in the period, the anticipated demand recovery heavily fueled bullish momentum in commodity markets. This was particularly notable for non-ferrous products such as copper and ferrous metals, which saw substantial price increases. During the peak consumption season, the expectation gap between anticipated and actual market outcomes took center stage. March and April, traditionally recognized as the high consumption period, serve as an ideal litmus test for robust market expectations. However, as we entered this period, the ensuing reality unveiled a different scenario: consumption data fell significantly short of expectations, as indicated by disappointing investment and consumption figures. Bullish expectations gave way to sobering reality, triggering a price downturn.
2) Silicon Valley Bank's bankruptcy catalyzed a wave of recession trade on commodity markets. Prior to this, domestic markets expressed overly optimistic expectations of recovery, while overseas markets exhibited excessively pessimistic expectations of a recession and a strong tendency toward interest rate cuts. However, favorable employment data released in February somewhat tempered these recessionary forecasts. Yet, in the wake of the Silicon Valley Bank debacle, the market found itself engulfed in a tumultuous state of transition expectations. This precipitated a dramatic downturn in international commodity prices, which was echoed by a concurrent drop in domestic commodity prices.
An excerpt from a famous Chinese history book, the Records of the Grand Historian, vividly illustrates the characteristic price fluctuations of commodities in the first half of the year: "Discussing abundance and scarcity allows understanding of value and cheapness. At the apex of value, cheapness follows; at the lowest ebb of cheapness, value ensues."
1. Prices are determined by supply and demand dynamics. When analyzing commodity pricing, supply and demand stand as the principal determinants. Other factors, like macroeconomic trends and market sentiment, indirectly affect prices by swaying supply and demand. Viewed in absolute values, the behavior of market participants moulds prices through their impact on supply and demand. From an industrial chain standpoint, the supply side escalates output in response to market expectations, while the demand side experiences a tepid recovery. Ultimately, an oversupply situation leads to a decrease in equilibrium prices.
2. Price fluctuations act as a pendulum, swayed by their intrinsic value. Much like investor sentiments that range from despair to euphoria, the farther the pendulum swings towards an extreme, the stronger its counter-movement to the opposite end. The pendulum never stays static at one extreme. Based on year-on-year commodity price trends, price movements follow distinct cyclical patterns. In Figure 3, the monthly average of the CRB Index is charted by year-on-year changes. Upon reaching extreme points—marked by either a 40% surge or a 20% drop in prices year-on-year—a directional price adjustment was triggered. A review of this round of adjustment, spanning the post-2020 period up until the end of June 2023, reveals that prices have tumbled below the initial level of this round of increase, heightening the potential for a subsequent directional price adjustment.

Price for the second half of the year: Navigating Complexity, Hidden Signals in the Macro Landscape
As of June 2023, from ferrous and non-ferrous metals held back by a sluggish domestic demand recovery, to energy and precious metals grappling with overseas risk events and pressures from economic downturns, to agricultural products focusing on refining supply-demand dynamics in the upcoming season, directional pricing based on these fundamentals has been nearly established, with upward momentum gathering force from the market's nadir. Marginal changes in supply and demand could serve as driving forces behind commodity pricing in the latter half of the year. In a market where fundamental expectations hold sway, long-term expectations could gain greater importance and potentially shape commodity spot fundamentals by influencing industrial profits or supply costs.
……
All information provided by SCI is for reference only, which shall not be reproduced without permission.
Please click "Read more" for the full article.
