

Sep 2024 PE Import Analysis
Introduction: In September 2024, there was a noticeable MoM decline in the import volume of PE, influenced by various factors. Let's delve deeper into this situation and forecast future trends.
Sep PE Import Volume Decreased by 6.86% MoM
China’s PE import volume further dropped in September 2024, hitting 1,136.63kt, down 6.86% MoM and 9.3% YoY. It totaled 10,194.09kt by the end of September this year, which increased by 3.69% from the same period last year. In September, China’s PE import volume declined for the second straight month, sitting at a medium level within the year.
Typically, August to September marks the transition period when downstream industries of PE gradually enter their peak season, which is called the “Golden September”. However, this year witnessed an overall weaker demand, which limited market momentum, causing China’s PE market price to move downwards, making its price a global low. This situation significantly reduced the attractiveness of China’s market for imported resources, leading to a shrinkage in China’s PE import volume as more goods flowed towards higher-priced overseas markets. Yet, under the backdrop of a weakening global macroeconomic environment and continuing economic downturn, foreign demand remained weak. Many Middle Eastern and European markets faced situations where prices were high but transactions were scarce, forcing a large volume of imports to flow back to the lower-priced yet still in-demand China’s market. The combined effect of these factors led to fierce competition among most general-purpose resources, accelerating the market downturn.

Import Volume from Major Origins Declined Mostly
In terms of the major origins, the import volume mostly fell in September.
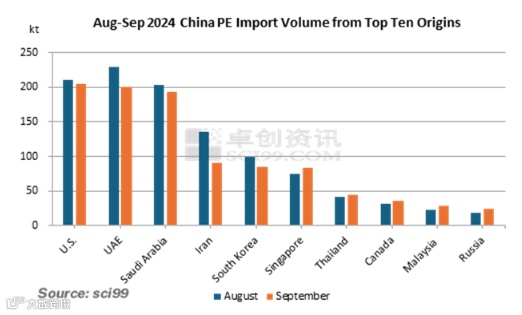
Specifically, the import volume from major origins like the UAE, U.S., Saudi Arabia, Iran, South Korea and Qatar saw notable decreases, while Singapore, Thailand, Canada, Malaysia, and Russia experienced increases. Among them, Iran, the UAE and South Korea had the top three reductions.
In terms of specific figures for September, the import volume from the U.S. was the highest at 205.2kt, down 5.7kt or 2.69% from August. The UAE ranked second with the volume of 200.7kt, decreasing by approximately 29.1kt or 12.65% from August. The import volume from Saudi Arabia dropped to third place at 193.6kt, down 9.3kt or 4.58% from August. Iran saw the largest decrease, ranking fourth at 90.3kt, down 45.5kt or 33.42% from August. The import volume from South Korea was 84.4kt, down 14.6kt or 14.73% from August. Conversely, the import volume from Russia increased to 24.3kt, up 5.9kt or 32.14% MoM, becoming the country with the largest increase in September imports. The import volume from Malaysia was 27.8kt, increasing by 23.58% MoM.
General Trade, Processing Trade with Imported Materials and Logistics Goods in Areas Under Special Customs Supervision Dominated
Looking at the trade modes for PE imports in September, the most prevalent were general trade, processing trade with imported materials, and logistics goods in areas under special customs supervision. Out of the total, September saw general trade imports at 959.3kt, down 3.83% from the previous month, accounting for 84.4% of total imports. The volume imported via processing trade with imported materials stood at 102.7kt, down 6.87% MoM, accounting for 9.04% of the total. The import volume via logistics goods in areas under special customs supervision was 59.9kt, down 30.61% MoM, accounting for 5.27%.

Forecast: PE Import Volume May Increase in October
SCI predicts that October may see a certain rebound in import volume. It should be noted that despite a decrease in PE import volume in September, it is still at a medium level over the past two years. This situation is due to complex reasons behind it, including weak overseas macro environment in September, decline in overall demand, and a lack of market transactions despite prices, leading to increased resistance for foreign traders to sell. Therefore, these traders have to sell their goods to China where prices are lower but demand persists. Although China’s domestic market was in its peak season in September, downstream industry demand this year was still significantly weaker than that in the same period in previous years, generally reflecting delayed demand. Additionally, affected by earlier unit maintenance, exchange rate fluctuations, and persistently high sea freight rates among other factors, traders faced significant pressure in shipping out goods. After a drop in September, PE prices rebounded but continued to decline. As China’s domestic demand increases in October, the attractiveness of imported resources is expected to rise, likely leading to a continued increase in import volume.
Among major import origins, although the import volume from mainstream sources showed a declining trend, some Southeast Asian and North American regions saw increases. Regarding trade modes, the main ones were general trade, processing trade with imported materials, and logistics goods in areas under special customs supervision, all showing varying degrees of reduction MoM.
Taking everything into consideration, the PE import volume in October 2024 may see an uptick. This is mainly due to the gradual increase in China’s domestic demand in October, enhancing the attractiveness of imported resources and potentially leading to an increase in supply. Meanwhile, the appreciation of the USD adds pressure on the sales of imported resources, limiting the extent of the increase to some degree.
All information provided by SCI is for reference only, which shall not be reproduced without permission.
Please click "Read more" for the full article.
