


主要在资本投入指数快速上升的影响下,3月万事达卡财新BBD中国新经济指数(NEI)出现反弹。
4月2日,财新智库莫尼塔和BBD联合发布数据显示,3月万事达卡财新BBD中国新经济指数(NEI)为33.3,即新经济投入占整个经济投入的比重为33.3%。
按可比口径计算,本月NEI比上月上升2.6个百分点,是2016年3月以来指数环比上升最快的一次。
NEI包括劳动力、资本和科技三项一级指标,它们在NEI中的权重分别是40%、35%和25%。
3月NEI的上升主要来自资本投入的快速上升。资本投入指数在近半年中的波动较大,但在3月出现了强势反弹,达到了38.5%,是NEI发布以来的最高值。
劳动力投入指数则继续下降,从2017年2月的31.6下降为的为30.2,为指数公布以来的最低值。科技投入指数则从上个月的31.5下降至30.8,同样出现了回落。
资本投入指数在近半年中的波动较大,并在近两月出现了显著下降,从2016年12月的38.8,下降至今年1月的29.8和2月的26.7。
从2016年7月开始,中国新经济指数报告由万事达卡冠名,指数名称正式更名为“万事达卡财新BBD中国新经济指数”。
万事达卡财新BBD中国新经济指数,是由财新智库(深圳)投资发展有限公司和成都数联铭品科技公司与北京大学国家发展研究院合作研发,每月2日上午10:00发布上月数据。相关指数目前是试运行阶段。
新经济指数(beta)旨在度量中国经济转型中新经济相对于传统经济或旧经济的活跃程度。新经济指数(beta)覆盖了节能与环保业、新一代信息技术与信息服务产业、生物医药产业、高端装备制造产业、新能源产业、新材料产业、新能源汽车产业、高新技术服务与研发业、金融服务与法律服务等9个类别,共111个行业。财新网(记者 李雨谦 )
3月万事达卡财新BBD中国新经济指数
从本月开始,发布万事达卡财新BBD中国新经济指数正式版。在正式版指数中,我们根据以往生成的大数据、新的经济形势以及可参照的基准,做了校验与调整,增加了“文化、体育与娱乐业”这一行业。
一、指数概览
2017年3月,万事达卡财新BBD中国新经济指数(NEI)为33.3,即新经济投入占整个经济投入的比重为33.3%。按可比口径计算,本月NEI比上月上升2.6个百分点,是2016年3月以来指数环比上升最快的一次。图1中蓝色线条表示行业调整前NEI试行版的数值,橙色线条表示行业调整后可比的变化,我们将在第二部分详细讨论NEI正式版与试行版的调整。

二、NEI 正式版的调整
NEI正式版加入了文化、体育和娱乐行业,将新经济行业扩展至十大行业。在之前NEI架构中,我们以战略新兴产业以及生产性服务业目录为蓝本,结合轻资产、高人力资本投入,确定了九大行业。在对2016年1至12月所有行业进行大数据分析后,我们发现文化、体育和娱乐行业也开始符合新经济的定义,主要表现如下:
1)文化、体育和娱乐行业的“高人力资本投入、轻资产”的特征逐渐明显。将劳动投入占比除以资本投入占比,我们可以算出每个行业的劳动资本比值,而文化、体育和娱乐业的劳动/资本比值如图2所示,从1.5上升至2.5,较其他行业有显著上升,说明该行业的劳动投入相对于资本投入的比重越来越大,“轻资产”特征更加明显。

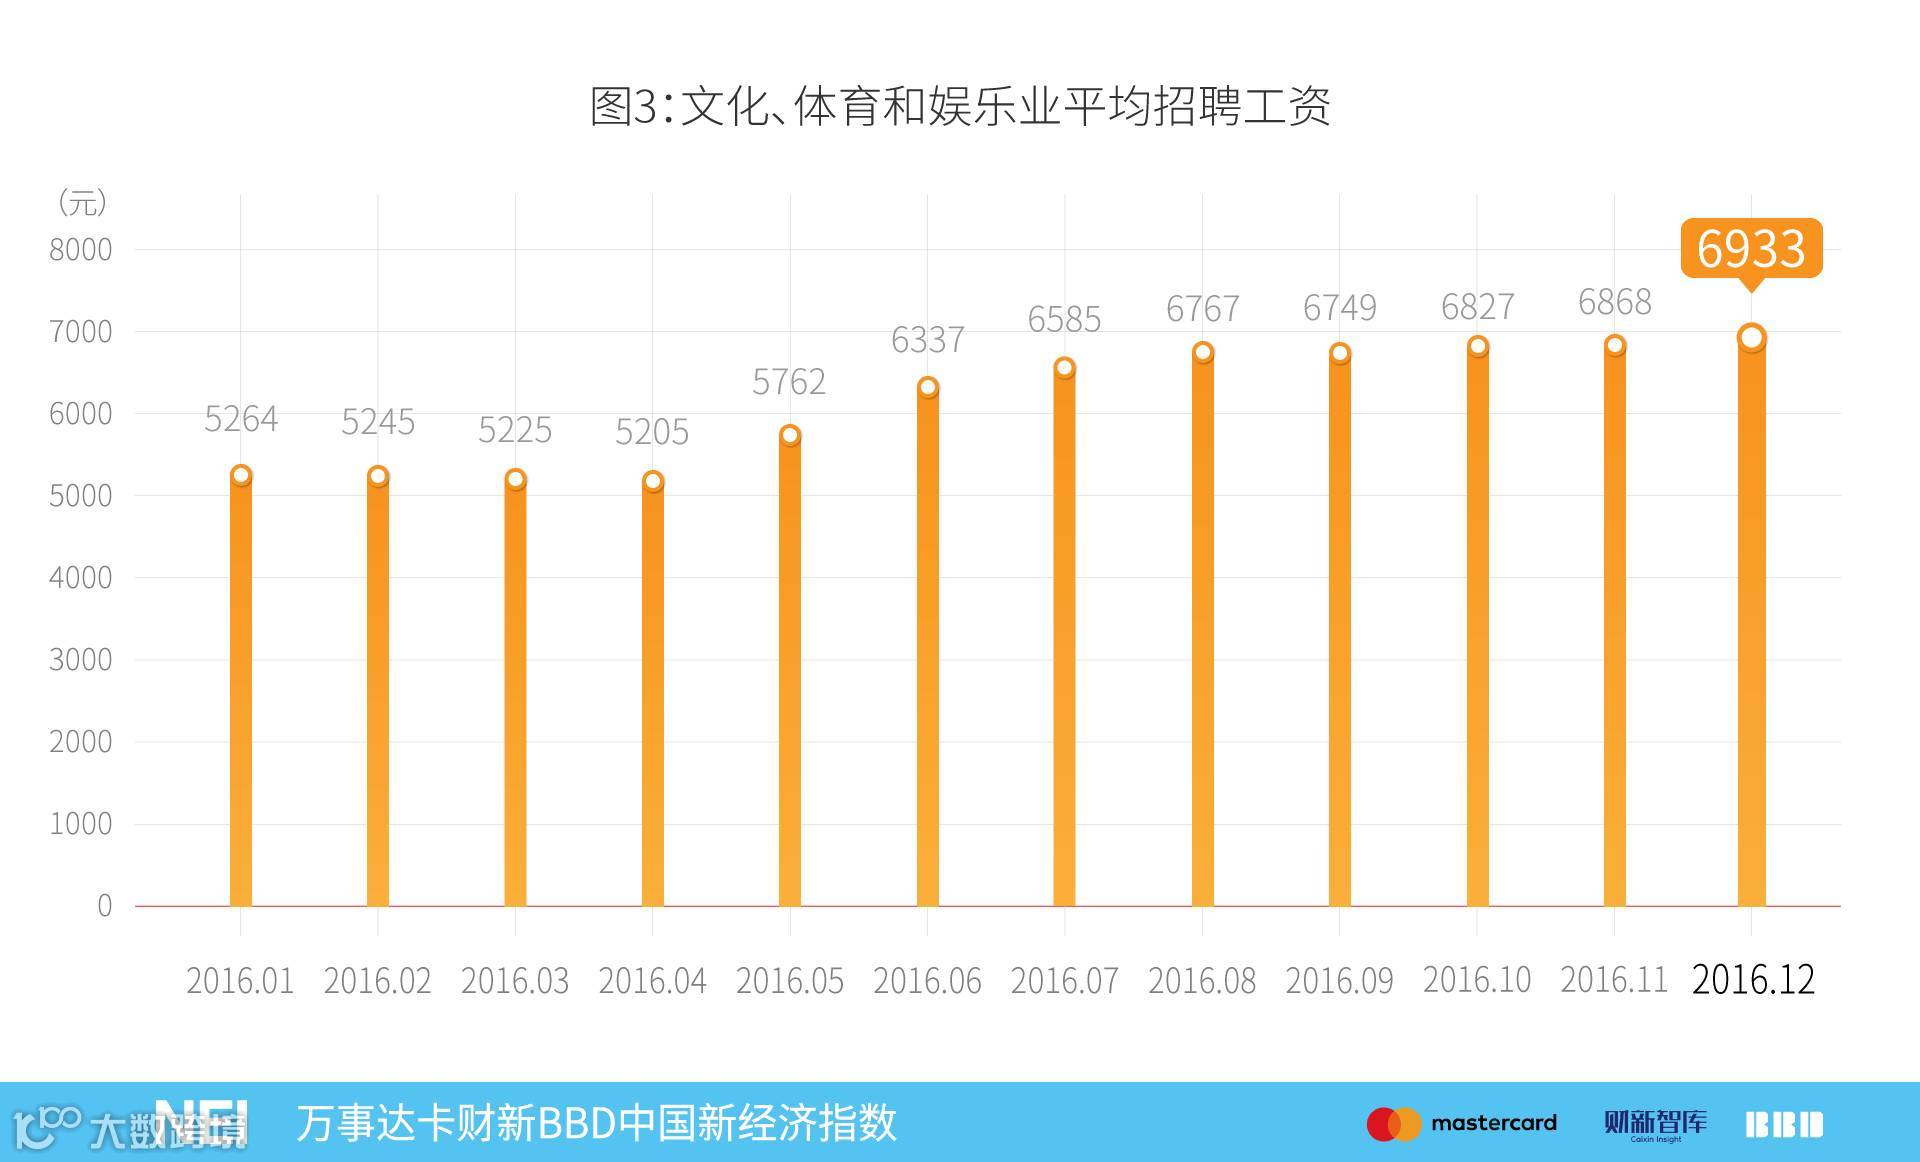
2)文化、体育和娱乐行业的招聘工资逐渐提高,见图3。2016年1月,文化、体育和娱乐业的平均招聘工资为5265元,到2017年3月,上升至6933元,是工资上升最快的行业之一,与上一个特征结合,证明“高人力资本投入” 的上升也同样成为文化、体育和娱乐业的基本特征。
3)文化、体育和娱乐业的增长较快。从产出角度看,2016年文化、体育和娱乐业的同比增长达到了14.4%,是服务业中增长最快的一部分,也成为了北京、杭州等地的产业政策主要支持行业。
根据以上三个原因,我们在NEI正式版中加入该行业,构成第十大行业。我们也将按照这样的惯例,每年检查一次各行业的运行特征,以此标准调整行业,力图全面、准确反映中国新经济的规模和发展趋势。
在实际操作中,文化、体育和娱乐产业对应国家统计局二位数行业代码中的90、91和92行业。与其他行业类似,我们首先根据公司注册信息中的经营范围确定一个公司是否属于文化、体育和娱乐业,再通过公司名称和行业的映射关系,对公司名称进行文本分析,计算每个公司落入不同行业概率的分布。具体计算方式见《中国新经济指数技术报告》。
图4显示了从2016年3月至2017年2月试行版与正式版NEI的比较。可以看到,两个版本各月数字上不尽相同,但是两者的走势仍然十分接近,两者之差便是加入了文化、体育和娱乐业的影响。

三、主要分项指标
NEI包括劳动力、资本和科技三项一级指标,它们在NEI中的权重分别是40%、35%和25%。2017年3月NEI的上升主要来自资本投入的快速上升。资本投入指数在近半年中的波动较大,但在3月出现了强势反弹,达到了38.5%,是NEI发布以来的最高值。劳动力投入指数则继续下降,从2017年2月的31.6下降为的为30.2,为指数公布以来的最低值。科技投入指数则从上个月的31.5下降至30.8,同样出现了回落(图5)。

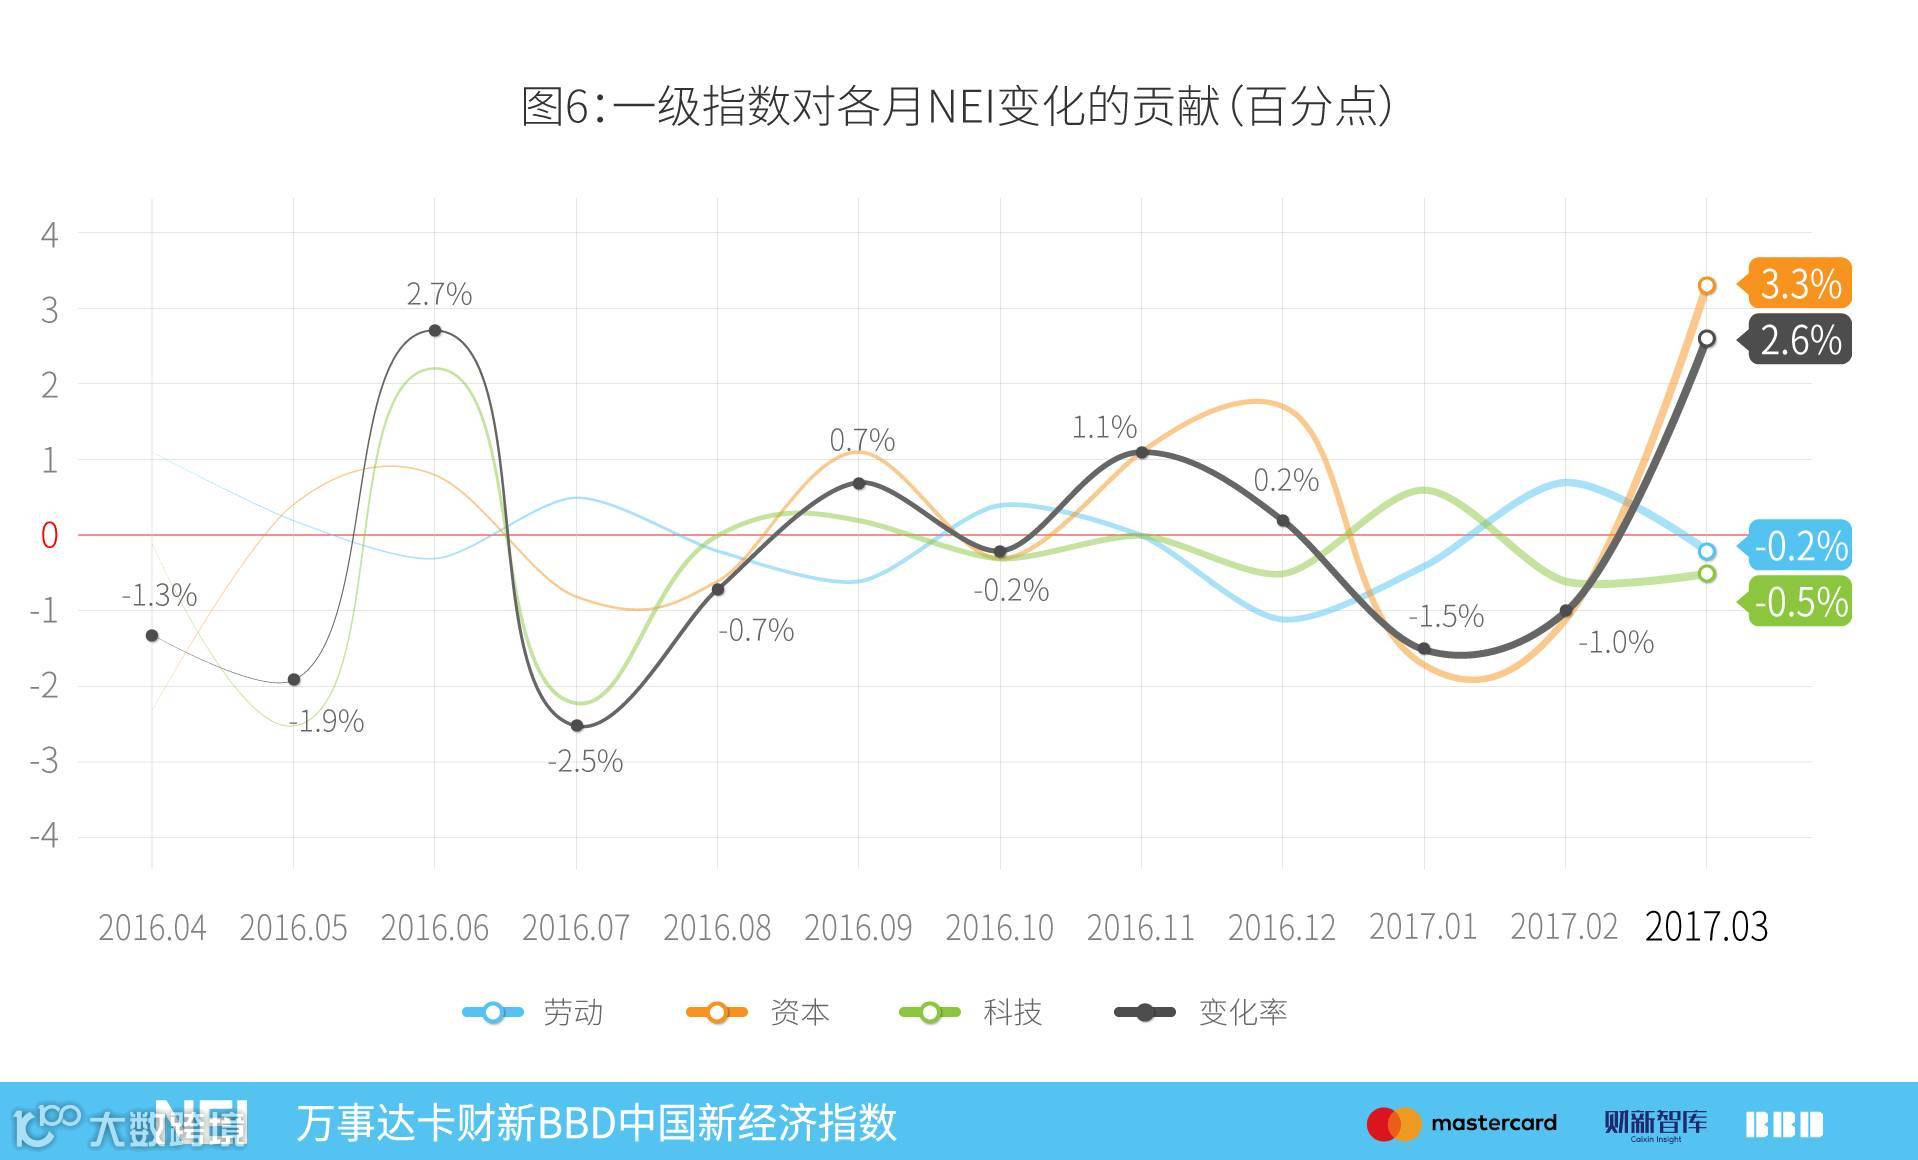
劳动力、资本和科技投入的变化绝对值分别为-0.5,3.3,和-0.2个百分点,与权重相乘求和后,对2017年3月NEI变化的贡献值为2.6(图6)。
分行业看,NEI中占比最大的行业为新一代信息技术与信息服务产业,2017年3月为总指数贡献了12.0个百分点,扭转了自2016年12月以来的下滑趋势。金融与法律服务业贡献排名第二,本月贡献4.8个百分点。高端装备制造业的贡献排名第三,本月贡献3.7个百分点(图7)。

四、新经济就业
2017年3月,新经济行业入职平均工资水平与上月基本持平,为每月8958元,上月为8947元(图8)。新经济工资主要来自51job、智联招聘、拉钩、赶集网等数个招聘网站的招聘信息,即对劳动力的需求工资。

2017年3月新经济行业招聘人数占全国总招聘人数比例有所下降,从30.2%下降为28.2%,新经济行业招聘总薪酬占全国总薪酬比重同样下降,但下降幅度较招聘人数比例低,从32.9%微降至32.1%。新经济行业的平均入职工资水平相对于全国平均入职工资水平有所上升,2017年3月新经济入职工资“溢价”为13.7%,高于上月的9.3%(图9)。近半年来,新经济行业的就业数量持续萎缩,而平均工资则相对稳定。

五、NEI、PMI 和 VAI
自NEI发布以来,我们持续关注着它与中国传统统计指标之间的关系。从图10我们可以发现,NEI与PMI的走势几乎完全相反。每当PMI指数上升时,新经济指数便出现下降;反之亦然。在过去17个月中,仅有3个月出现了背离。

我们同时注意到,近来NEI与VAI(工业增加值)当月同比的趋势出现了新的变化。在2016年7月以前,两者走向几乎完全一致,而在2016年8月后,两者走势则呈负相关(图11)。

NEI、PMI与VAI的对比向我们揭示了一种可能——当PMI保持在荣枯线以下(50或以下)时,对工业增长贡献较大的产业属于高端制造业,而这部分制造业恰好是NEI的一个重要部分,因此两者走势相同。但当PMI突破50并稳定在50以上时,支持工业增长的产业变成了传统制造业,工业增加值同比增长的趋势便开始与NEI相反。这样的现象说明,制造业中出现了新旧产业的分化,其中新兴制造业更加具有抗风险、反周期的能力,说明了“抓新放旧”的必要性。
六、城市新经济排名
2017年3月新经济总量指数城市排名前20名如图12所示,北京、上海、广州、成都、杭州排名前五。在加入文化、体育和娱乐业之后,深圳暂时掉出前五名。该排序计算每个投入指标在所有城市中的排序百分位,再将百分位加权平均,体现的是近半年城市间新经济总量排名。
图13计算了2016年9月到2017年3月城市NEI平均排名,前五名为北京、杭州、上海、广州、深圳。


更多咨询敬请联络:
万事达卡
公共关系副总裁 吴焕宇
电话:+86-10-8519-9304
电邮:Huanyu_wu@mastercard.com
财新智库
财新智库莫尼塔董事长兼首席经济学家 沈明高
电话:+86-10-8518-8170转8618
电邮:minggaoshen@caixin.com
公关总监 马玲
电话:+86-10-8590-5204
电邮:lingma@caixin.com
BBD(数联铭品)
BBD(数联铭品)首席经济学家 陈沁
电话:+86-28-65290823
电邮:chenqin@bbdservice.com
版权声明
万事达卡财新BBD中国新经济指数,是由财新智库(深圳)投资发展有限公司和成都数联铭品科技公司共同研发,与北京大学国家发展研究院合作,经过近一年努力,于2016年3月2日在北京首发的指数产品,此后每月2日上午10:00发布上月数据。
关于万事达卡:
万事达卡(纽交所股票交易代码:MA),
www.mastercard.cn,是全球性的支付与科技公司。通过运营全球最快的支付处理网络,万事达卡将超过210个国家和地区的消费者、金融机构、商户、政府和企业连接在一起。万事达卡的产品和解决方案使得每个人在购物、旅行、企业经营、财务管理等日常商业活动都变得更容易、更安全和更高效。敬请关注我们的“万事达卡”官方微信以及在新浪的官方微博@万事达人,以获悉动态并参与互动。也可访问万事达卡新闻中心或万事达卡互动中心获取更多资讯。
关于财新:
财新传媒是提供财经新闻的全媒体集团,依托专业的团队和强大的原创新闻优势,以网站、移动端、期刊、视频、图书、会议等多层次的业务平台,为中国最具影响力的受众群,提供准确、全面、深入的财经新闻产品。财新智库是财新传媒通过孵化另行建立的高端金融资讯服务平台,旨在通过发展金融数据业务,壮大宏观经济研究队伍,服务于智库业务客户。详细信息,敬请浏览www.caixin.com。
关于BBD:
BBD(数联铭品)是行业领先的大数据解决方案提供商,紧密围绕新经济,通过动态尽调、信用评级、风险定价和经济指数四个步骤,BBD提供从微观到宏观的大数据服务。详细信息,敬请浏览:http://www.bbdservice.com。
报告英文版:
March 2017
MasterCard Caixin BBD China New Economy Index
Released:10:00 am Beijing Time April-02-2016
Thirteen months after the first release of the MasterCard Caixin BBD China New Economy Index, we start to release its official version this month. We made adjustment to the previously released trial version based on big data and new economic development, and added “culture, sports, and entertainment” sector to the original index.
Overview
In March 2017, the MasterCard Caixin-BBD New Economy Index (NEI) reading came in at 33.3, indicating that the New Economy accounted for 33.3% of overall economic input activities that month (Chart 1). With the adjustment of new industry, the NEI recorded a 2.6 ppts increase from February, the highest M/M increase since March 2016. In chart 1, the blue line shows the NEI before adjustment, and the orange line indicates the change in NEI after changes of industry. We will discuss in detail in the following section about the comparison between two versions of the NEI.

Adjustment to NEI
NEI official version added “culture, sports, and entertainment (CSE)” sector, thus expanding new economy industries into ten sectors. In our previous NEI structure, we referred to new strategic industries and modern services, coupled with light asset and relatively high investment in human capital, to identity nine new economy industries. After analyzing the big data in 2016, we found out that the CSE sector is now in line with our definition of the new economy. The main characteristics are:
1)The CSE sector is showing an increasing trend of “higher investment in human capital, and light asset”. From the perspective of labor capital ratio, its value increased from 1.5 to 2.5 in 2016, a significant increase compared with other industries, thus showing a stronger asset-light characteristic (Chart 2).


2) The wage of the CSE sector has been showing an increasing trend as well (Chart 3). In January 2016, its average wage was around RMB 5265, and then increased to RMB 6933 in March 2017, which belongs to one of the industries with fastest growing salaries.
3)The CSE sector grows at a relatively fast pace. From the perspective of output, in 2016, this sector grew 14.4% Y/Y, which was the fastest growing industry in the service sector, and it was the main sector that Beijing and Hangzhou governments wanted to promote.
Based on the above three reasons, we included the “culture, sports, and entertainment” sector in the official version of the NEI, constituting the tenth industry of the new economy. We will follow this practice to examine the characteristics of each industry, and make relevant and timely adjustment in order to more accurately and comprehensively reflect the trend and development of China’s new economy.
Technically, we use the two-digit industry code (complied by the National Bureau of Statistics) of 90, 91 and 92 to reflect culture, sports and entertainment. Similar to the data collection of other new economy industries, we use corporation registration information to justify whether a company belongs to the CSE industry, and then calculate the probability distribution of industries based on the analysis of the company name and connection to industries. Details are discussed in the Technique Report of China New Economy Index.
Chart 4 shows a comparison between the trial and official version of the NEI from March 2016 to March 2017. Although these two indexes differ in exact numbers, they show a similar trend, and the difference comes from the addition of the new industry.

Primary Inputs
The NEI includes labor, capital and technology inputs that account for 40%, 35% and 25% of the total weight of the index, respectively. Among the primary inputs, the increase in the March NEI reading came primarily from increasing capital investment. Capital investment showed wide fluctuations in the recent half year, but it rebounded strongly in March, coming in at 38.5%, which is the highest value since the release of NEI. Labor inputs continue to decline, dropping to 30.2 from 31.6 in February, the lowest number since the release of NEI. Technology input declined to 30.8 from 31.5 in February (Chart5).

Percentage changes in labor, capital and technology inputs were -0.5, 3.3 and -0.2 ppts, respectively. After accounting for the sum of their weightings, the net NEI change was a 2.6 ppts increase from February (Chart 6).

Looking at the sub-sectors, the New IT industry formed the largest proportion of the New Economy Index, contributing 12.0 ppts to NEI, which is the first increase since December 2016. Financial and Legal Services came second, contributing 4.8 ppts. The third largest contributor was Advanced Equipment Manufacturing with 3.7 ppts (Chart 7).

New Economy Employment
In March 2017, the average monthly entry level salary of the New Economy was RMB 8,958 per month, similar to last month’s level of RMB 8,947 (Chart 8). New Economy wage information is compiled from online websites of career platforms and recruitment services including 51job and Zhaopin, as well as other sites that list job demands.

Hiring in the New Economy sectors accounted for 28.2% of total hiring in February, a decrease from the previous month’s 30.2%. The compensation share of New Economy sectors also saw a mild decline, from 32.9% to 32.1%. The entry level salary premium of the New Economy was 13.7% as compared to economy-wide counterparts, an increase from 9.3% in February (Chart 9). In the recent halt year, employment in the New Economy sectors continue to shrink, while average salaries remain relatively stable.

NEI, PMI and VAI
Since the release of NEI, we have continued to focus its relation to the traditional macro indicators in the economy. From Chart 10, we can see that the monthly trend between NEI and official manufacturing PMI moves almost in opposite directions. When the PMI index rises, the NEI declines, and vice versa. Over the past 17 months, only 3 months showed divergence to this trend

We also note that the recent relationship between NEI and the growth of VAI (value added of industries) has changed. Before July 2016, they moved together, but after August 2016, they became negatively correlated (Chart 11).
.

The comparison of NEI, PMI and VAI reflect a possibility – when PMI is below the 50 line or when the economy is in the contraction territory, high-end manufacturing sectors contribute more to VAI growth, and they are important components of the new economy, and thus VAI and NEI show moves in tandem. However, when the PMI exceeds and stabilizes above 50, traditional industries dominate in VAI growth, and thus VAI yoy growth and NEI become negatively correlated. This pattern shows that traditional and high-end manufacturing sectors display divergent trend, while high-end manufacturing sector is more risk resistant, and counter-cyclical.
City Rankings of the New Economy
Based on overall New Economy rankings, the top twenty cities are shown in Chart 12. The top five cities are Beijing, Shanghai, Guangzhou, Chengdu, and Hangzhou. After the inclusion of “culture, sports, and entertainment” sector, Shenzhen no longer belongs to the top five. Rankings are based on a moving average of the percentile rank of indicators for the city in the past 6 months.
Chart 13 showed the average NEI city rankings between September 2016 and March 2017. The top five cities are Beijing, Hangzhou, Shanghai, Guangzhou, and Shenzhen.


For further information please contact:
MasterCard
Mr. Wu Huanyu, Vice President of Public Relations
Tel: +86-10-8519-9304
Email: Huanyu_wu@mastercard.com
Caixin Insight Group
Dr. Minggao Shen, President & Chief Economist
Tel: +86-10-8104-8016
Email: minggaoshen@caixin.com
Ma Ling, Public Relations
Tel: +86-10-8590-5204
Email: lingam@caixin.com
BBD
Chen Qin, Chief Economist
Tel:+86-28-65290823
Email:chenqin@bbdservice.com
The MasterCard Caixin BBD China New Economy Index is the fruit of a research partnership between Caixin Insight Group and BBD, in collaboration with the National Development School, Peking University. The subject of a year of research, the NEI was first publically released on March 2, 2016 and will be issued the 2nd of every month at 10:00am China Standard Time.
About Caixin
Caixin Media is China's leading media group dedicated to providing financial and business news through periodicals, online content, mobile applications, conferences, books and TV/video programs. Caixin Media aims to blaze a trail that helps traditional media prosper in the new media age through integrated multimedia platforms. Caixin Insight Group is a high-end financial data and analysis platform. For more information, please visit www.caixin.com.
About MasterCard
MasterCard (NYSE: MA), www.mastercard.com, is a technology company in the global payments industry. We operate the world’s fastest payments processing network, connecting consumers, financial institutions, merchants, governments and businesses in more than 210 countries and territories. MasterCard’s products and solutions make everyday commerce activities – such as shopping, traveling, running a business and managing finances – easier, more secure and more efficient for everyone. Follow us on Twitter @MasterCardAP and @MasterCardNews, join the discussion on the Beyond the Transaction Blog and subscribe for the latest news on the Engagement Bureau.
About BBD (Business Big Data)
BBD is a leading Big Data and quantitative business analytics firm specializing in the analysis of the high-growth industries emerging in Mainland China. Through dynamic data tracking, credit analysis, risk pricing and economic index construction, BBD provides its clients with a wide range of services at both the macro and micro level. For more information, please visit http://www.bbdservice.com/.
