

(财新网记者 张娱.)主要在劳动力投入指数和资本投入指数下降的影响下,2月万事达卡财新BBD中国新经济指数(NEI)继续下降。
3月2日,财新智库莫尼塔和BBD联合发布数据显示,2月,万事达卡财新BBD中国的新经济指数(NEI)为28.3,即新经济投入占整个经济投入的比重为28.3%。该值较2018年1月的28.7继续下降0.4个百分点,是新经济指数公布以来的最低值。
NEI包括劳动力、资本和科技三项一级指标,它们在NEI中的权重分别是40%、35%和25%。
2月NEI的下降主要来自劳动投入的下降和资本投入的下降。
资本投入指数在近半年中的波动较大,并在近两月出现了显著下降,从2017年12月的38.8,下降至今年1月的29.8和2月的26.7。
2月劳动力投入指数上升至29.4,上月为28.6,维持了从2016年5月开始的在28与30之间的波动。
科技投入指数有所上升,达到28.9,比上月的27.2上升了1.7个百分点。
从2016年7月开始,中国新经济指数报告由万事达卡冠名,指数名称正式更名为“万事达卡财新BBD中国新经济指数”。
万事达卡财新BBD中国新经济指数,是由财新智库(深圳)投资发展有限公司和成都数联铭品科技公司与北京大学国家发展研究院合作研发,每月2日上午10:00发布上月数据。相关指数目前是试运行阶段。
新经济指数旨在度量中国经济转型中新经济相对于传统经济或旧经济的活跃程度。新经济指数覆盖了节能与环保业、新一代信息技术与信息服务产业、生物医药产业、高端装备制造产业、新能源产业、新材料产业、新能源汽车产业、高新技术服务与研发业、金融服务与法律服务、体育文化和娱乐等10个类别,超过140个行业。
2018年2月
万事达卡财新BBD中国新经济指数

一、指数概览
2018年2月,万事达卡财新BBD中国新经济指数(NEI)录得29.8,即新经济投入占整个经济投入的比重为29.8%。2017年以来,NEI指数波动较大,按可比口径计算,本月NEI比上月下降1.5个百分点(图1)。本月NEI的下降主要来自科技投入的下降。
NEI新经济据于以下定义:首先,高人力资本投入、高科技投入、轻资产;其次,可持续的较快增长;第三,符合产业发展方向。NEI所含行业详见《万事达卡财新BBD中国新经济指数技术报告》与《万事达卡财新BBD中国新经济指数报告(2017年3月)》。

二、主要分项指标
NEI包括劳动力、资本和科技三项一级指标,它们在NEI中的权重分别是40%、35%和25%。2018年2月NEI的下降主要来自科技投入的下降。科技投入指数从2017年10月开始呈现震荡走势,本月指数录得29.7,环比下降4.7。资本投入指数从2017年9月以来呈缓慢上升趋势,本月指数录得31.7,环比上升0.2。劳动力投入指数自2017年7月以来出现下降趋势,本月环比下降1.0,指数录得28.2(图2)。

劳动力、资本和科技投入的变化绝对值分别为-0.4,0.1,和-1.2个百分点,与权重相乘求和后,对2018年2月NEI变化的贡献值为-1.5(图3)。

分行业看,NEI中占比最大的行业为新一代信息技术与信息服务产业,2018年2月为总指数贡献了10.5个百分点;本月名次上升较快的行业为节能与环保业,贡献率为3.9个百分点,位列第二名;高端装备制造业贡献率排名下降最多,从上月的第三名下降至本月第七名,贡献率为1.9个百分点(图4)。

三、新经济就业
2018年2月,新经济行业入职平均工资水平环比继续上升,为每月10759元,较上月增长278元,刷新有史以来最高值(图5)。新经济工资主要来自51job、智联招聘、拉钩、赶集网等数个招聘网站的招聘信息,即对劳动力的需求工资。

2018年2月新经济行业招聘人数占全国总招聘人数比例出现较大幅度下降,为27.6%,同时新经济行业招聘总薪酬占全国总薪酬比重略有下降,为28.8%。新经济行业的平均入职工资水平相对于全国平均入职工资水平出现下降。2018年2月新经济入职工资“溢价”为4.4%,低于上月4.8%(图6)。近几月新经济行业的平均工资溢价总体低于2017年上半年新经济行业的平均工资溢价。

四、分地区外来人口比例变化
本月我们将根据春运带来的人口流动变化,结合劳动力市场变化进行研究。
首先,我们根据航班数据计算了不同城市春运流动人口的变化。我们分别计算春节前16-30天的人口流出数量以及春节前1-15天的人口流出数量,并将两者的差额设置为“春运人口”。将春运人口数量除以平日流动人口数量,可以算出在春运期间回乡人口占春运期间通勤人口的比例。我们将该比例定义为本次报告中的“外来人口比例”。
从2017年到2018年,不同城市的“外来人口比例”发生了很大的变化(图7),其中“外来人口比例”增加最大的城市是呼和浩特、合肥、贵阳等,而北京、上海、广州等城市的“外来人口比例”则增加较少,宁波、厦门等城市甚至在过去一年中出现外来人口流失的现象。可以看到,2018年中西部省份的省会是“外来人口比例”增加最快的一批城市。值得一提的是,东三省省会虽然未在图中出现,但也在全国城市中位居前列,比如长春市的“外来人口比例”增加就达到了10%,哈尔滨也有8.8%,处于增长前列。

五、分地区春运工资溢价
图8和图9分别从城市和行业的角度,计算了春节前1-15天与春节前16-30天的平均工资比例。一般来说,人口供给的减少和劳动力中需要在春运期间回乡的人口比例的提高都会增加靠近春节时的工资上升幅度。我们把这个上升幅度定义为“春运工资溢价”。

可以看到,在春运期间,深圳市是工资溢价最高的城市,随后是太原、长春等。另外,通过对比2017年和2018年不同城市“春运工资溢价”的前十名,我们发现仅有太原一个城市保留了前十名,但是其“春运工资溢价”的幅度也有所降低。
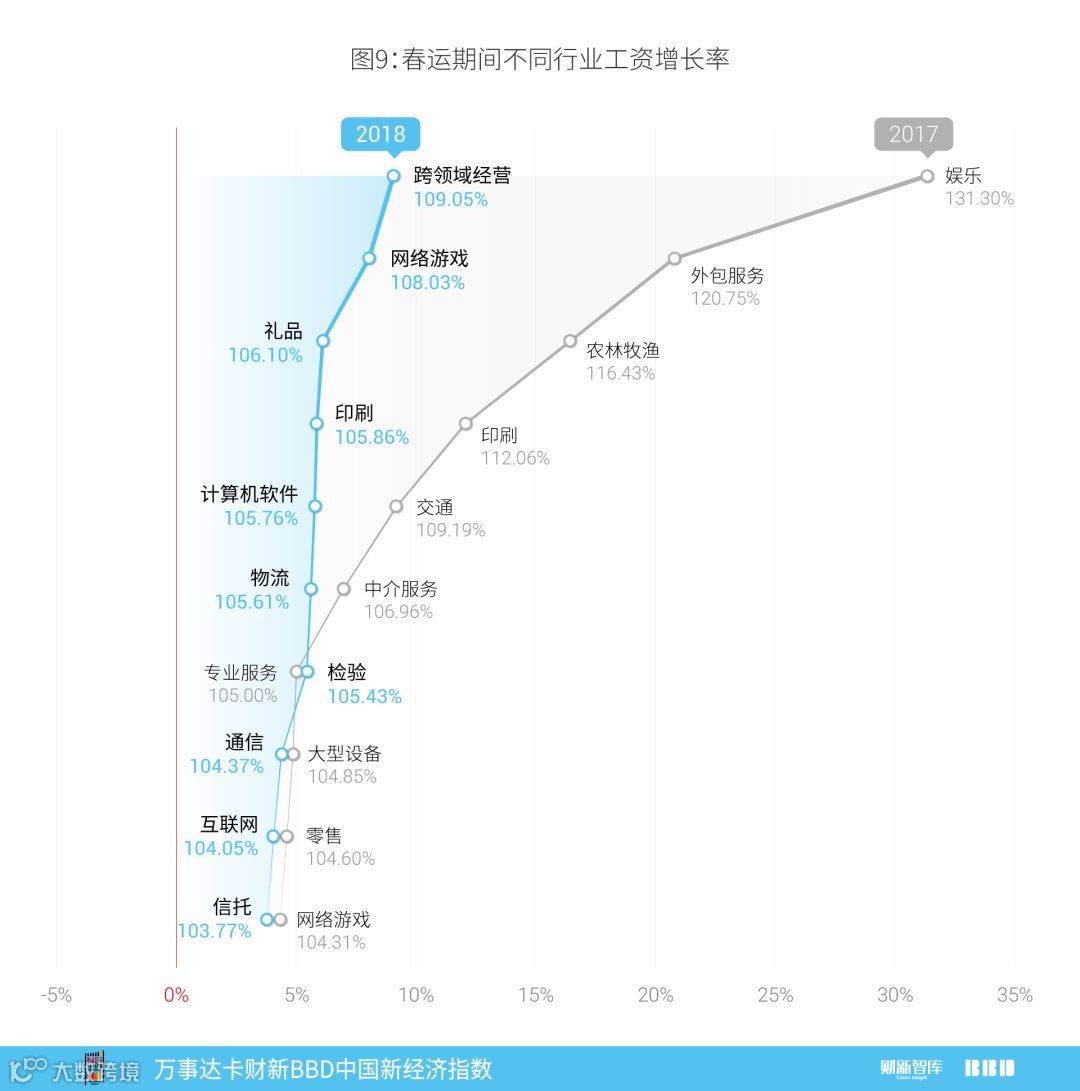
六、分行业春运工资溢价
图9用类似的算法计算了不同行业的“春运工资溢价”,与城市的情况类似,不同行业的“春运工资溢价”也出现了下降。在2017年,一些行业接近春节时的工资涨幅达到了20%甚至30%,而在2018年,这些行业工资涨幅不再明显。两年的“春运工资溢价”前十名行业相比,仅有印刷和网络游戏两个行业连续处于前十名。
这三幅图展示出的现象表明,目前我国流动人口的集中程度有所下降,从集中于东部大城市,到了中西部二线城市。同时,不同城市(尤其是一线城市)和行业对于外来人口的依赖程度也有所下降,体现在外来人口集中于某个行业现象的减弱,以及外来人口整体比例的下降。这一方面体现了人口流动的方向变化,另一方面,可能也与外来人口本地化以及农村人口城镇化的进程有关。
七、城市新经济排名
2018年2月新经济总量城市排名前20名如图10所示,北京、上海、广州、杭州、南京排名前五。该排序计算每个投入指标在所有城市中的排序百分位,再将百分位加权平均,体现的是近半年城市间新经济总量排名。

图11计算了2017年8月到2018年2月城市NEI平均排名,前五名为北京、杭州、上海、济南、深圳。

更多咨询敬请联络:
万事达卡
大中华区公共关系副总经理 吴焕宇
电话:+86-10-8519-9304
电邮:Huanyu_wu@mastercard.com
财新智库
财新智库高级经济学家 王喆
电话:+86-10-8590-5019
电邮:zhewang@caixin.com
公关总监 马玲
电话:+86-10-8590-5204
电邮:lingma@caixin.com
BBD(数联铭品)
BBD(数联铭品)首席经济学家 陈沁
电话:+86-28-6529-0823
电邮:chenqin@bbdservice.com
版权声明
万事达卡财新BBD中国新经济指数,是由财新智库(深圳)投资发展有限公司和成都数联铭品科技公司共同研发,与北京大学国家发展研究院合作,经过近一年努力,于2016年3月2日在北京首发的指数产品,此后每月2日上午10:00发布上月数据。
关于万事达卡
万事达卡(纽交所股票交易代码:MA),www.mastercard.cn,是全球性的支付与科技公司。通过运营全球最快的支付处理网络,万事达卡将超过210个国家和地区的消费者、金融机构、商户、政府和企业连接在一起。万事达卡的产品和解决方案使得每个人在购物、旅行、企业经营、财务管理等日常商业活动都变得更容易、更安全和更高效。敬请关注我们的“万事达卡”官方微信以及在新浪的官方微博@万事达人,以获悉动态并参与互动。也可访问万事达卡新闻中心或万事达卡互动中心获取更多资讯。
关于财新
财新传媒是提供财经新闻的全媒体集团,依托专业的团队和强大的原创新闻优势,以网站、移动端、期刊、视频、图书、会议等 多层次的业务平台,为中国最具影响力的受众群,提供准确、全面、深入的财经新闻产品。财新智库是财新传媒通过孵化另行建立的高端金融资讯服务平台,旨在通过发展金融数据业务,壮大宏观经济研究队伍,服务于智库业务客户。详细信息,敬请浏览 www.caixin.com。
关于BBD
BBD(数联铭品)是行业领先的大数据解决方案提供商,紧密围绕新经济,通过动态尽调、信用评级、风险定价和经济指数四个步骤,BBD提供从微观到宏观的大数据服务。详细信息,敬请浏览:http://www.bbdservice.com。
February 2018
Mastercard Caixin BBD China New Economy Index

Overview
In February 2018, the Mastercard Caixin BBD New Economy Index (NEI) reading came in at 29.8, indicating that the New Economy accounted for 29.8% of overall economic input activities that month, down 1.5 ppts from January (Chart 1). The declining NEI was due to the decrease of technology input. New economy is defined as following: 1) human capital intensive, technology intensive and capital light; 2) sustainable rapid growth, and 3) in line with the strategic new industries defined by the government. Please refer to our previous reports (March 2016 and March 2017) for the list of NEI sectors.

Primary Inputs
The NEI includes labor, capital and technology inputs that account for 40%, 35% and 25% of the total weights of the index, respectively. The decline in the February NEI reading came from the decrease of technology inputs (Chart 2). Technology input index fluctuated widely since October 2017, coming in at 29.7, with 4.7 MoM decrease. Capital investment showed a slow growth trend since September 2017. It continued to rise to 31.7 this month, with 0.2 MoM increase. Labor input index declined moderately since July 2017, dropping to 28.2 this month, with 1.0 MoM decrease.

Taking the weight into account, percentage changes in labor, capital and technology inputs were -0.4, 0.1, and -1.2 ppts, respectively. The net NEI change was -1.5 ppts in total (Chart 3).

Looking at the sectors, the New IT industry formed the largest proportion of the New Economy Index, contributing 10.5 ppts to NEI. Energy Conservation & Environment Protection was the industry with fast growth in February, contributing 3.9 ppts and ranking the second. Advanced Equipment Manufacturing came seventh from third, the biggest drop in ranking, contributing 1.9 ppts in January (Chart 4).

New Economy Employment
In February 2018, the average monthly entry level salary of the New Economy was RMB 10,759 per month, increasing from last month’s level of RMB 10,481 and reaching the highest level since 2016 (Chart 5). New Economy wage information is compiled from online websites of career platforms and recruitment services including 51job and Zhaopin, as well as other sites that list job demands.

Hiring in the New Economy sectors accounted for 27.6% of total hiring in February, much lower than the previous month’s 28.5%. At the same time, the total compensation share of New Economy sectors decreased slightly to 28.8%, which meant the average entry salary level of New Economy was lower than national average entry wage level. The entry level salary premium of the New Economy was 4.4% as compared to economy-wide counterparts, decreasing from 4.8% in January (Chart 6). In the recent half year, the average salary premium of the New Economy was lower than the first half of 2017 generally.

Change in Ratio of Non-resident Employees Based on Major Airports
Based on Spring Festival travel season (a.k.a. Chunyun period) data, we analyzed the population flow and change in labor market.
Daily passengers outflow at major airports in the Chunyun period were used in our research. We calculated the averages of passengers outflows in 16-30 days and 1-15 days before Chinese New Year respectively and defined the difference as “Chunyun population”. The ratio of Chunyun population to daily passenger outflow was highly related to the ratio of non-resident employees since most of non-resident working population were travelling back home for holidays.
The ratios of non-resident employees in different cities had changed from 2017 to 2018 (Chart 7). Hohhot, Hefei and Guiyang saw the largest increase in the ratio. However, Beijing, Shanghai and Guangzhou were among cities with slight increase and Ningbo, Xiamen and other cities were even losing people in the past year. It could be seen that the ratio of non-resident employees in provincial capitals of central and western provinces experienced the fastest increase in 2018. It was worth mentioning that, although the capitals of the northeastern provinces did not show up in the top 10 cities, they were also among the cities attracting more migrant people. Specifically, the ratio in Changchun increased by 10% and that in Harbin increased by 8.8% in 2018.

Salary Premium during Spring Festival across Cities
In general, labor supply dropped in Spring Festival due to outflow of non-residents and the average salary went up in the meantime. We might define the increase as “Spring Festival salary premium”. Spring Festival salary premium across industries and cities was shown in Chart 8 and 9.

In 2018 Spring Festival, Shenzhen was the city with the highest salary premium, followed by Taiyuan and Changchun. In addition, by comparing the top 10 cities with the highest premium in 2017 and 2018, we had only Taiyuan staying in top ten cities in both years, with decreasing salary premium.
Salary Premium during Spring Festival across Industries
Spring Festival salary premium across industries was explored in Chart 9. Same as that across cities, the salary premium across industries declined as well. In Spring Festival of 2017, employees were paid 20% more in some industries and it’s not the case in 2018. Among industries with highest increases in salary premium in 2017 Spring Festival, did only Printing and Online Game stay in top ten one year later.

In summary, the population flow in China was less concentrated in eastern major cities recently and the second-tier cities in the central and western regions were attracting more people. At the same time, specific cities (especially first-tier cities) and industries relied less on non-resident working population, reflected in lowering non-resident employees ratio and Spring Festival salary premium. We conjectured that it was in part due to urbanization of rural population.
City Rankings of the New Economy
Based on overall New Economy rankings, the top twenty cities were shown in Chart 10. The top five cities were Beijing, Shanghai, Guangzhou, Hangzhou, and Nanjing. Rankings are based on a weighted average of the percentile rank of indicators for the city in the past 6 months.

Chart 11 showed the average NEI city rankings between July 2017 and January 2018. The top five cities were Beijing, Hangzhou, Shanghai, Ji’nan and Shenzhen.

For further information please contact:
MasterCard
Mr. Wu Huanyu, Director, Communications
Tel:+86-10-8519-9304
Email:Huanyu_wu@mastercard.com
Caixin Insight Group
Dr. Wang Zhe, Senior Economist
Tel:+86-10-8590-5019
Emails:zhewang@caixin.com
Ma Ling, Public Relations
Tel:+86-10-8590-5204
Email:lingma@caixin.com
BBD
Dr. Chen Qin, Chief Economist
Tel:+86-28-6529-0823
Emails:chenqin@bbdservice.com
The MasterCard Caixin BBD China New Economy Index is the fruit of a research partnership between Caixin Insight Group and BBD, in collaboration with the National Development School, Peking University. The subject of a year of research, the NEI was first publically released on March 2, 2016 and will be issued the 2nd of every month at 10:00am China Standard Time.
About Caixin
Caixin Media is China's leading media group dedicated to providing financial and business news through periodicals, online content, mobile applications, conferences, books and TV/video programs. Caixin Media aims to blaze a trail that helps traditional media prosper in the new media age through integrated multimedia platforms. Caixin Insight Group is a high-end financial data and analysis platform. For more information, please visit www.caixin.com.
About MasterCard
MasterCard (NYSE: MA), www.mastercard.com, is a technology company in the global payments industry. We operate the world’s fastest payments processing network, connecting consumers, financial institutions, merchants, governments and businesses in more than 210 countries and territories. MasterCard’s products and solutions make everyday commerce activities – such as shopping, traveling, running a business and managing finances – easier, more secure and more efficient for everyone. Follow us on Twitter @MasterCardAP and @MasterCardNews, join the discussion on the Beyond the Transaction Blog and subscribe for the latest news on the Engagement Bureau.
About BBD (Business Big Data)
BBD is a leading Big Data and quantitative business analytics firm specializing in the analysis of the high-growth industries emerging in Mainland China. Through dynamic data tracking, credit analysis, risk pricing and economic index construction, BBD provides its clients with a wide range of services at both the macro and micro level. For more information, please visit http://www.bbdservice.com/.
