

【财新网】(记者 张娱)在资本投入上升的带动下,3月万事达卡财新BBD中国新经济指数(NEI)从2月的历史低点反弹。
财新智库和BBD 4月2日联合发布数据显示,3月NEI录得28.3,即新经济投入占整个经济投入的比重为28.3%,高于2月0.9个百分点。
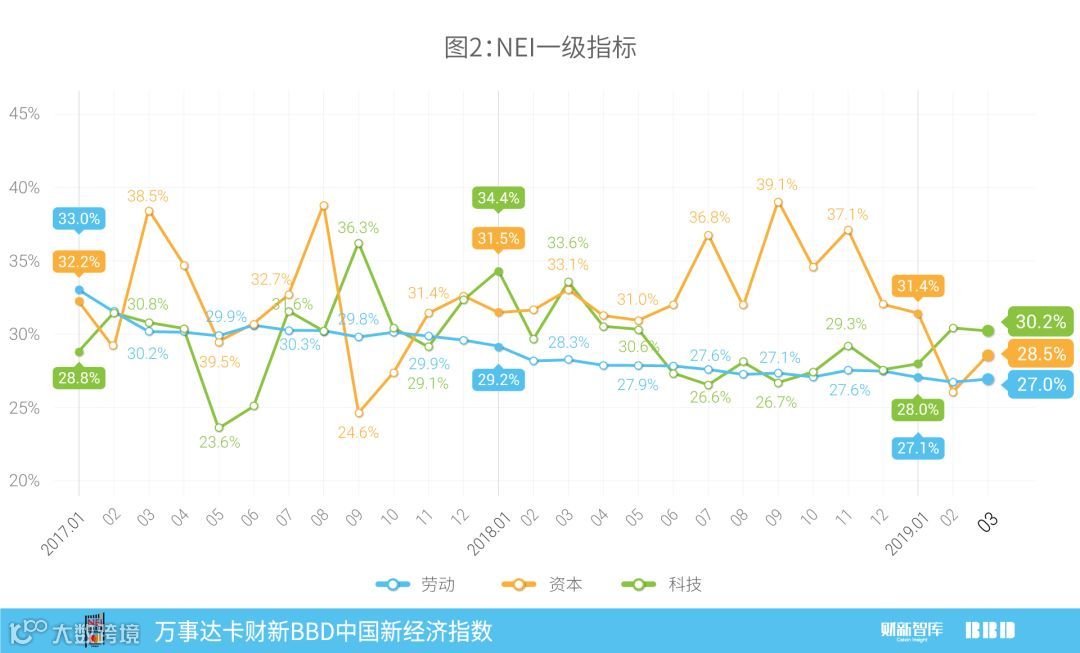
NEI包括劳动力、资本和科技三项一级指标,在NEI中的权重分别是40%、35%和25%。
从分项指标来看,资本投入回升是3月NEI反弹的主因。资本投入指数近一年来波动较大,3月录得28.5,环比上升2.4个百分点;科技投入指数自从2018年7月起波动回升,3月录得30.2,环比下降0.2个百分点;劳动力投入指数近半年来波动下降,3月录得27.0,环比上升0.2个百分点。
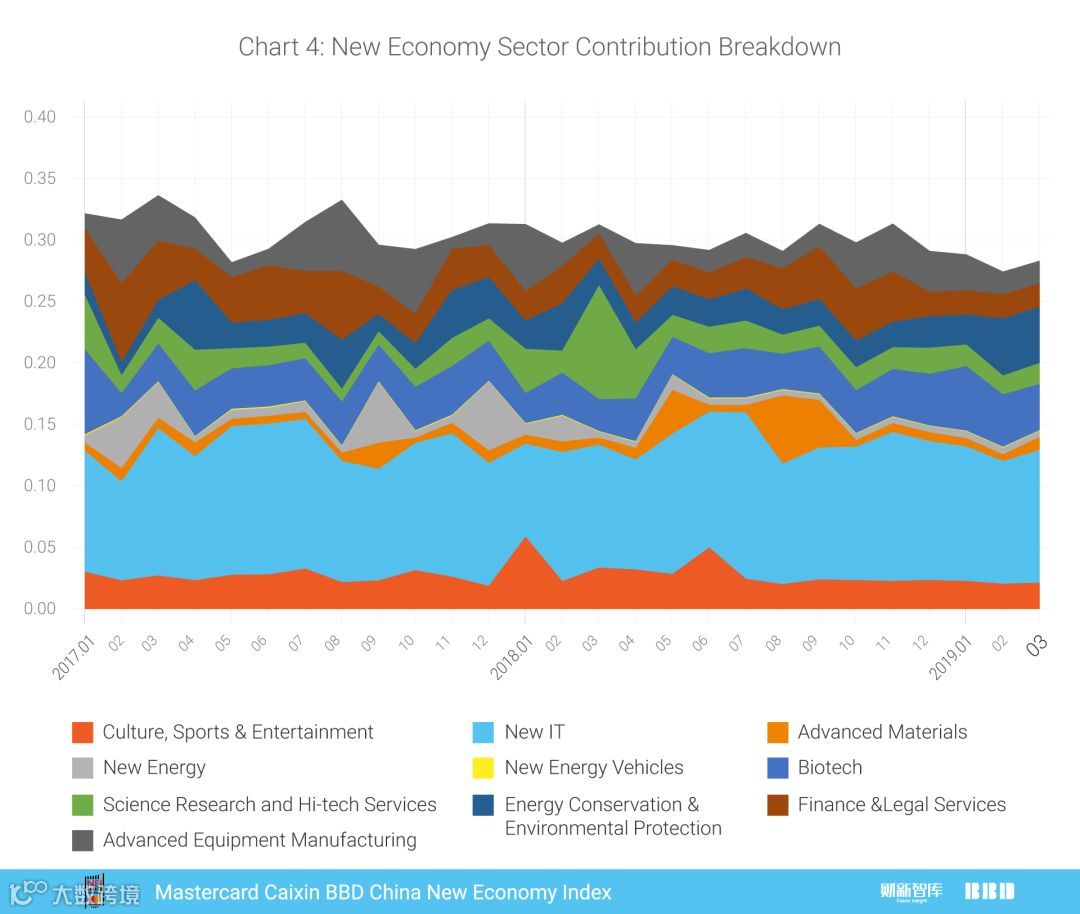
从行业贡献度来看,新一代信息技术与信息服务产业在NEI中占比最大,3月贡献了11个百分点;占比最低的为新能源汽车产业,仅贡献了0.1个百分点。
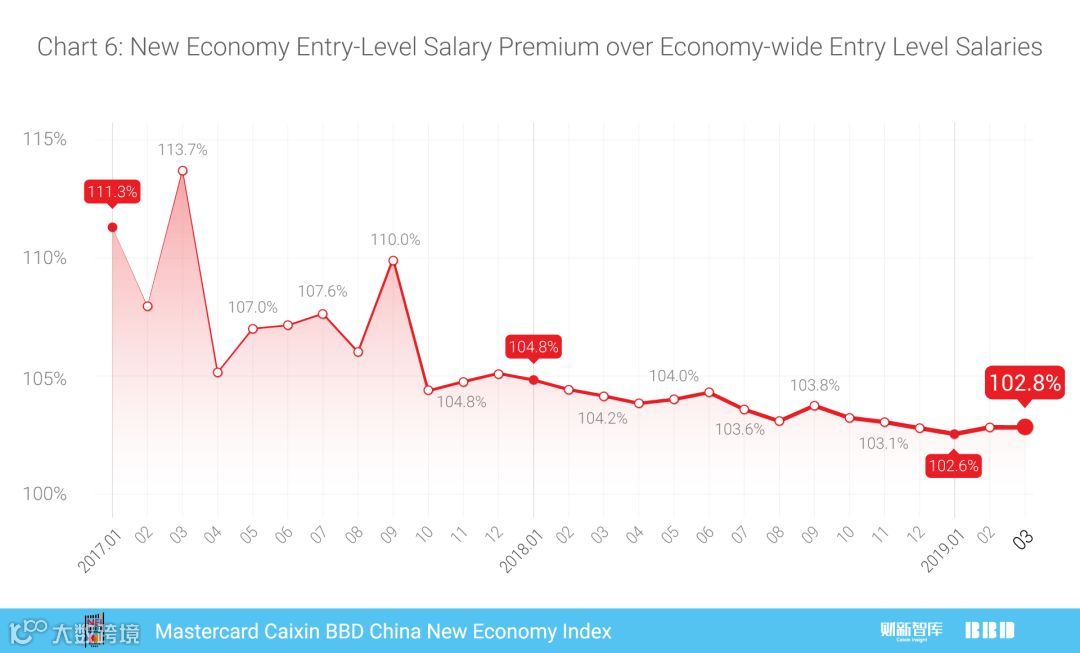
3月新经济行业入职平均月工资为10533元,较上月下降95元;新经济行业招聘人数和招聘总薪酬在全国总招聘人数和招聘总薪酬中的占比,均较上月上升0.2个百分点,意味着新经济行业的平均入职工资水平相对于全国平均入职工资水平基本保持不变。3月新经济入职工资“溢价”录得2.8%,较上月持平。
招聘数据显示,经济处于复苏阶段,但2018年下半年开始的经济去集中化趋势在2019年一季度发生了逆转,呈现出向大企业集中的特征。当前规模最大的10%企业招聘占比自2019年1月起迅速上升,速度甚至快于2017年下半年。
报告认为,一般经济复苏开始阶段,由于进出成本更低,中小企业更易在早期获得订单,而本轮中小企业和民营企业的复苏却并未持续太久,国有企业和大型企业的复苏较快占据市场主流,挤出中小企业。向大企业集中化的经济复苏或会抑制总需求上升,进而影响经济复苏的健康程度。此外,3月平均入职工资水平较上月持平,则说明当前经济复苏和劳动生产率的提高并未同步出现。
从规上出口企业招聘数据来看,近期普工和操作工招聘数量已经止跌,销售代表招聘数量则出现明显下降,意味着库存压力得到缓解。报告称,若经济继续回升,普工与操作工招聘数量将会上升。
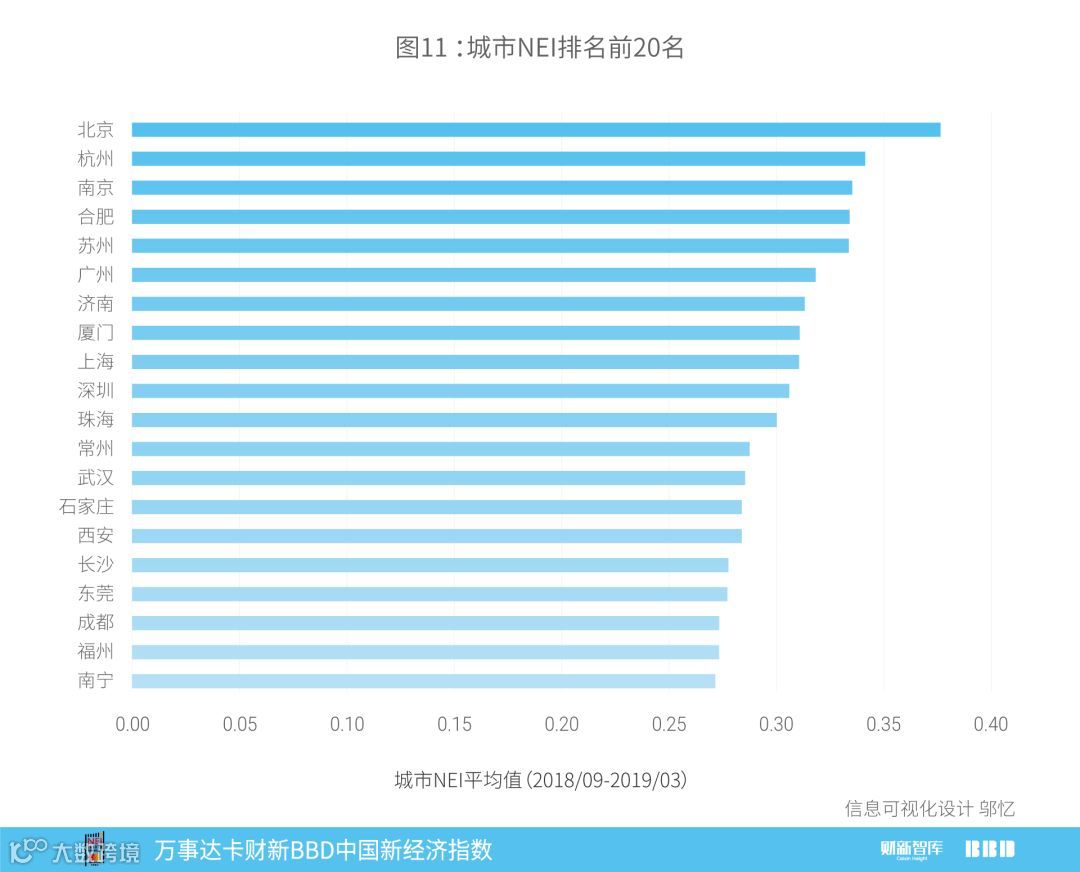
按地区来看,2018年9月至2019年3月,北京、杭州、南京、合肥和苏州在城市NEI排名中排行前五。
万事达卡财新BBD中国新经济指数,是由财新智库、成都数联铭品科技公司与北京大学国家发展研究院合作研发,每月2日上午10:00发布上月数据。
新经济指数旨在度量中国经济转型中新经济相对于传统经济或旧经济的活跃程度。新经济指数覆盖了节能与环保业、新一代信息技术与信息服务产业、生物医药产业、高端装备制造产业、新能源产业、新材料产业、新能源汽车产业、高新技术服务与研发业、金融服务与法律服务、体育文化和娱乐等10个类别,超过140个行业。

一、指数概览
2019年3月,万事达卡财新BBD中国新经济指数(NEI)录得28.3,即新经济投入占整个经济投入的比重为28.3%。2017年以来,NEI指数波动较大,按可比口径计算,本月NEI比上月上升0.9个百分点(图1)。本月NEI的上升主要来自资本投入的上升。
NEI新经济据于以下定义:首先,高人力资本投入、高科技投入、轻资产;其次,可持续的较快增长;第三,符合产业发展方向。NEI所含行业详见《万事达卡财新BBD中国新经济指数技术报告》与《万事达卡财新BBD中国新经济指数报告(2017年3月)》。

二、主要分项指标
NEI包括劳动力、资本和科技三项一级指标,它们在NEI中的权重分别是40%、35%和25%。2019年3月NEI的上升主要来自资本投入的上升。资本投入指数近一年来波动较大,本月指数录得28.5,环比上升2.4。科技投入指数从2018年7月开始波动回升,本月指数录得30.2,环比下降0.2。劳动力投入指数近半年来波动下降,本月指数录得27.0,环比上升0.2(图2)。
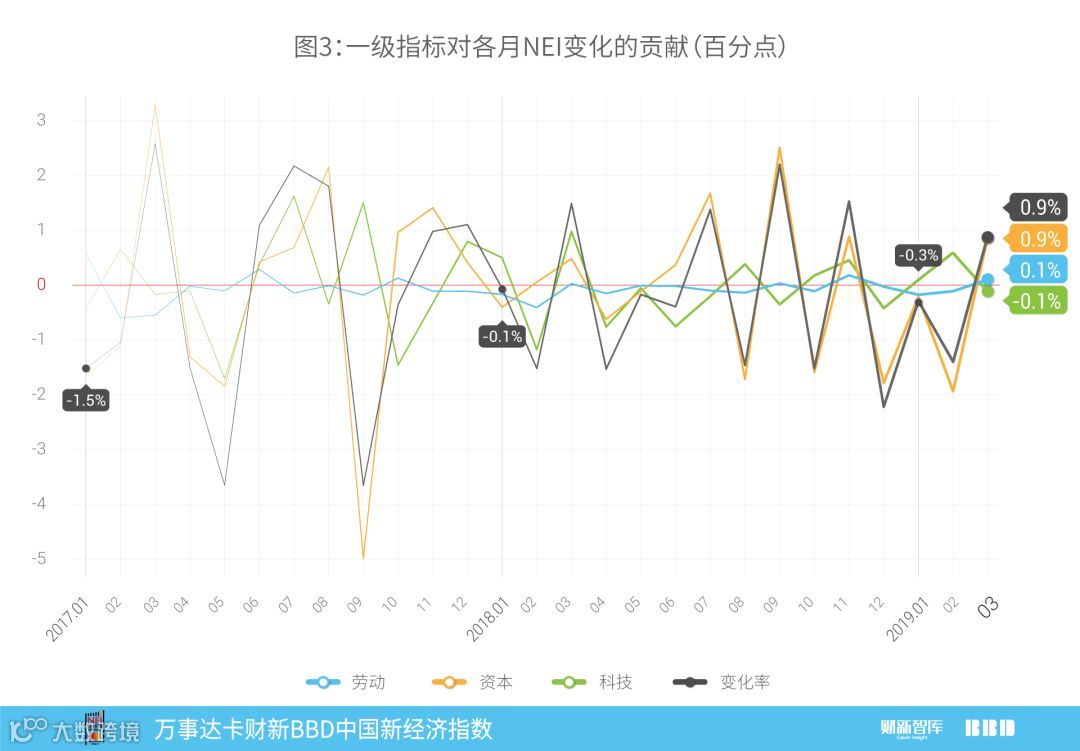
劳动力、资本和科技投入的变化百分比分别为0.1,0.9,和-0.1个百分点,与权重相乘求和后,对2019年3月NEI变化的贡献值为0.9%(图3)。
分行业看,本月各行业排名与上月保持一致,NEI中占比最大的行业为新一代信息技术与信息服务产业,2019年3月为总指数贡献了11.0个百分点;占比最低的行业为新能源汽车产业,2019年3月为总指数贡献了0.1个百分点(图4)。

三、新经济就业
2019年3月,新经济行业入职平均工资水平为每月10533元,较上月下降95元(图5)。新经济工资主要来自51job、智联招聘、拉钩、赶集网等数个招聘网站的招聘信息,即对劳动力的需求工资。

2019年3月,新经济行业招聘人数占全国总招聘人数比例和新经济行业招聘总薪酬占全国总薪酬比例均较上月上升0.2%,这意味着新经济行业的平均入职工资水平相对于全国平均入职工资水平基本保持不变。本月新经济入职工资“溢价”为2.8%,较上月持平微跌(图6)。

四、从劳动力数据看经济走势
正如我们之前的判断,本月新经济指数有所回升,但就业数据表现出新的特征。图7显示,目前国有企业和民营企业招聘人数占总招聘的比例重新回至2018年3月的水平,对于2017年的情况,这样的变化并非季节因素所致。图8显示,规模最大的10%企业的招聘占比从2019年1月开始迅速上升,其上升速度甚至高于2017年下半年。从这两组数据看,2018年下半年开始的经济去集中化趋势在2019年一季度发生了逆转。一般情况下,经济复苏开始阶段,由于进出成本更低,中小企业更易在早期获得订单,而本轮中小企业和民营企业的复苏却并未持续太久,国有企业和大型企业的复苏较快占据了市场主流,并对中小企业进行了挤出。


考虑到总体的就业数据仍在上升,我们认为经济仍然处在回升阶段。但以经济向大企业集中化为特征的复苏可能会抑制总需求的上升,进而影响经济复苏的健康程度。本月平均入职工资水平与上月持平微跌,说明当前经济复苏和劳动生产率的提高并未同步出现。
图9列出了规上出口企业部分岗位的招聘数量。去年11月的报告中,我们对比普工操作工和销售代表的招聘数量,说明抢出口效应和去库存压力的存在。近几个月,普工和操作工的招聘数量已经止跌,销售代表则出现了明显下降,这可能意味着库存压力得到缓解。如果经济继续回升,那么我们预期普工与操作工的招聘数量将会上升。

五、城市新经济排名
2019年3月新经济总量城市排名前20名如图10所示,北京、上海、深圳、广州和杭州排名前五。该排序计算每个投入指标在所有城市中的排序百分位,再将百分位加权平均,体现的是近半年城市间新经济总量排名。

图11计算了2018年9月到2019年3月城市NEI平均排名,前五名为北京、杭州、南京、合肥和苏州。
更多咨询敬请联络:
万事达卡
大中华区公共关系副总裁 吴焕宇
电话:+86-10-8519-9304
电邮:Huanyu_wu@mastercard.com
财新智库
财新智库高级经济学家 王喆
电话:+86-10-85905019
电邮:zhewang@caixin.com
公关总监 马玲
电话:+86-10-8590-5204
电邮:lingma@caixin.com
BBD(数联铭品)
BBD(数联铭品)首席经济学家 陈沁
电话:+86-28-65290823
电邮:chenqin@bbdservice.com
版权声明
万事达卡财新BBD中国新经济指数,是由财新智库(深圳)投资发展有限公司和成都数联铭品科技公司共同研发,与北京大学国家发展研究院合作,经过近一年努力,于2016年3月2日在北京首发的指数产品,此后每月2日上午10:00发布上月数据。
关于万事达卡:
万事达卡(纽交所股票交易代码:MA),www.mastercard.cn,是全球性的支付与科技公司。通过运营全球最快的支付处理网络,万事达卡将超过210个国家和地区的消费者、金融机构、商户、政府和企业连接在一起。万事达卡的产品和解决方案使得每个人在购物、旅行、企业经营、财务管理等日常商业活动都变得更容易、更安全和更高效。敬请关注我们的“万事达卡”官方微信以及在新浪的官方微博@万事达人,以获悉动态并参与互动。也可访问万事达卡新闻中心或万事达卡互动中心获取更多资讯。
关于财新:
财新传媒是提供财经新闻的全媒体集团,依托专业的团队和强大的原创新闻优势,以网站、移动端、期刊、视频、图书、会议等多层次的业务平台,为中国最具影响力的受众群,提供准确、全面、深入的财经新闻产品。财新智库是财新传媒通过孵化另行建立的高端金融资讯服务平台,旨在通过发展金融数据业务,壮大宏观经济研究队伍,服务于智库业务客户。详细信息,敬请浏览 www.caixin.com。
关于BBD:
BBD(数联铭品)是行业领先的大数据解决方案提供商,紧密围绕新经济,通过动态尽调、信用评级、风险定价和经济指数四个步骤,BBD提供从微观到宏观的大数据服务。详细信息,敬请浏览:http://www.bbdservice.com。

Mastercard Caixin BBD China New Economy Index
Overview
In March 2019, the Mastercard Caixin BBD NewEconomy Index (NEI) reading came in at 28.3, indicating that the New Economyaccounted for 28.3% of overall economic input activities that month, up 0.9ppts from February (Chart 1). The rising NEI was due to the increase of capitalinput. New economy is defined as following: 1) human capital intensive,technology intensive and capital light, 2) sustainable rapid growth, and 3) inline with the strategic new industries defined by the government. Please referto our previous reports (March 2016 and March 2017) for the list of NEI sectors.

Primary Inputs
The NEI includes labor, capital andtechnology inputs that account for 40%, 35% and 25% of the total weights of theindex, respectively. The rising in the March NEI reading came from the increaseof capital input (Chart 2). Capital input fluctuated widely in the recent year,rebounding to 28.5 this month, with 2.4 MoM increase. Technology input indexwas on an uptrend since July 2018, coming in at 30.2 this month, with 0.2 MoMdecrease. Labor input index showed a stable trend in recent half year,increasing slightly to 27.0 this month, with 0.2 MoM increase.

Taking the weights into account, percentagechanges in labor, capital and technology inputs were 0.1, 0.9, and -0.1 ppts,respectively. The net NEI change was 0.9 ppts in total (Chart 3).

As for sectors, the rankings were the sameas previous month, with the New IT industry formed the largest proportion ofthe New Economy Index, contributing 11.0 ppts to NEI. New Energy Vehicles wasthe industry with the lowest ranking, only contributing 0.1 ppts this month(Chart 4).
New Economy Employment
In March 2019, the average monthlyentry-level salary of the New Economy was RMB 10,533, decreasing from lastmonth’s level of RMB 10,627(Chart 5). New Economy wage information is compiled from online websites ofcareer platforms and recruitment services including 51job and Zhaopin, as wellas other sites that list job openings.

Both of the recruitment and compensationshares of the New Economy increased by 0.2% compared to February. Accordingly,the average entry salary level of New Economy remained stable compared to thewhole economy. The entry-level salary premium of the New Economy decreasedslightly to 2.8% as compared to economy-wide counterparts (Chart 6).
Economic TrendsBased on Employment Data
As we projected, the NEI rebounded in Marchbut some features were worth noting.
Chart 7 showed the employment proportions ofstate-owned enterprises and private ones in the whole market returned to thelevel in March 2018, which were not seasonal changes when 2017 was referred to.So did the employment of large and small enterprises (Chart 8). The employmentof largest 10% enterprises experienced faster rises in past three months thanit did so in the second half of 2017. Decentralization of economy, whichstarted since the second half of 2018, had stopped and reversed in the firstquarter of 2019. In general, small and medium enterprises (SMEs) are morelikely to expand productions in the beginning of economic recovery due to itslower operation cost. But in current recovery, SMEs and private enterpriseswere not in a sustainable recovery and were crowed out by state-owned and large counterparts.


The economy is still at the stage ofrecovery due to the rising figures in employment. However, recovery withcentralization of large enterprises might depress the demand and weaken therebound. The salary in March was almost the same as last month indicatingdivergence between economic recovery and the improvement of labor productivity.
We decomposed the employment data of exportoriented enterprises above designated size in Chart 9. Last November, we tookthese employment data as measurements of trade friction and destocking affects.In recent months, the employment of general workers and operators stoppedfalling, but the employment of sales representatives dropped significantly,indicating the diminishing destocking pressure. If the economy continues to recover,the employment of general workers and operators are expected to rise in thecoming months. We will keep close eyes in the second quarter on the aggregatedemand.

City Rankings of the New Economy
Based on overall New Economy rankings, thetop twenty cities were shown in Chart 10. The top five cities were Beijing,Shanghai, Shenzhen, Guangzhou and Hangzhou. Rankings are based on a weightedaverage of the percentile rank of indicators for the city in the past six months.

Chart 11 showed the average NEI cityrankings between September 2018 and March 2019. The top five cities wereBeijing, Hangzhou, Nanjing, Hefei and Suzhou.

For furtherinformation please contact:
Mastercard
Mr. Wu Huanyu, Director, Communications
Tel:+86-10-8519-9304
Email:Huanyu_wu@mastercard.com
Caixin Insight Group
Dr. Wang Zhe, Senior Economist
Tel:+86-10-85905019
Emails:zhewang@caixin.com
Ma Ling, Public Relations
Tel:+86-10-8590-5204
Email:lingma@caixin.com
BBD
Dr. Chen Qin, ChiefEconomist
Tel:+86-28-65290823
Emails:chenqin@bbdservice.com
The Mastercard Caixin BBD China New EconomyIndex is the fruit of a research partnership between Caixin Insight Group andBBD, in collaboration with the National Development School, Peking University.The subject of a year of research, the NEI was first publically released onMarch 2, 2016 and will be issued the 2nd of every month at 10:00am ChinaStandard Time.
About Caixin
Caixin Media is China's leading media groupdedicated to providing financial and business news through periodicals, onlinecontent, mobile applications, conferences, books and TV/video programs. CaixinMedia aims to blaze a trail that helps traditional media prosper in the newmedia age through integrated multimedia platforms. Caixin Insight Group is ahigh-end financial data and analysis platform. For more information, pleasevisit www.caixin.com.
About Mastercard
Mastercard (NYSE: MA), www.mastercard.com,is a technology company in the global payments industry. We operate the world’s fastest paymentsprocessing network, connecting consumers, financial institutions, merchants,governments and businesses in more than 210 countries and territories.Mastercard’s products and solutions make everydaycommerce activities – such as shopping, traveling,running a business and managing finances – easier, moresecure and more efficient for everyone. Follow us on Twitter @MastercardAP and@MastercardNews, join the discussion on the Beyond the Transaction Blog andsubscribe for the latest news on the Engagement Bureau.
About BBD (BusinessBig Data)
BBD is a leading Big Data and quantitativebusiness analytics firm specializing in the analysis of the high-growthindustries emerging in Mainland China. Through dynamic data tracking, creditanalysis, risk pricing and economic index construction, BBD provides itsclients with a wide range of services at both the macro and micro level. Formore information, please visit http://www.bbdservice.com/.
