

【财新网】(实习记者 张娱)受科技投入增加影响,3月万事达卡财新BBD中国新经济指数(NEI)出现上升。
4月2日,财新智库和BBD联合发布数据显示,3月万事达卡财新BBD中国新经济指数(NEI)录得31.3,即新经济投入占整个经济投入的比重为31.3%,较2月上升1.5个百分点。
NEI包括劳动力、资本和科技三项一级指标,在NEI中的权重分别是40%、35%和25%。
从分项指标来看,科技投入是3月NEI出现上升的主因。3月科技投入指数录得 33 .6,环比提高3.9个百分点,自去年10月以来呈现震荡走势;资本投入指数录得33.1,环比上升1.4个百分点,延续从2017年9月以来的缓慢增长趋势;劳动力投入指数环比增加0.1个百分点至28.3,结束2017年7月以来的持续下降。
从行业贡献度来看,3月新一代信息技术与信息服务产业对NEI占比最大,贡献了10个百分点。科学研究和技术服务业上升较快,贡献9.3个百分点,位列第二。新能源产业贡献率排名下降最剧烈,从上月第六名降至本月第九名,仅贡献0.5个百分点。
从新经济就业来看,新经济行业入职平均工资出现下降,月工资为10265元,较上月减少494元。值得注意的是,新经济行业招聘人数占全国总招聘人数比例有所上升,但招聘总薪酬占比保持不变,说明新经济行业的平均入职工资相对于全国平均入职工资出现下降。
从新增企业占总新增企业比重看,建筑工程、教育、建筑、汽车行业近两年来持续上升。传播、电子商务则持续下降。
对比新增就业和工资水平,2018年第一季度,出口占比在适中区间的企业,就业增加和工资提升幅度较大,效率增长最快。这表明出口占比较低的企业吸纳就业和工资水平均有限,中国当前不能仅靠内部消化产品来提高效率;出口占比最高的企业在提高效率表现上也不尽如人意,以往“大进大出、来料加工”模式不能继续成为企业发展的方向。
分地区来看,2017年9月至2018年3月,杭州、北京、上海、济南和深圳在城市NEI排名中排行前五。
万事达卡财新BBD中国新经济指数,由财新智库、成都数联铭品科技公司与北京大学国家发展研究院合作研发,每月2日上午10:00发布上月数据。
新经济指数旨在度量中国经济转型中新经济相对于传统经济或旧经济的活跃程度。新经济指数覆盖了节能与环保业、新一代信息技术与信息服务产业、生物医药产业、高端装备制造产业、新能源产业、新材料产业、新能源汽车产业、高新技术服务与研发业、金融服务与法律服务、体育文化和娱乐等10个类别,超过140个行业。
2018年3月
万事达卡财新BBD中国新经济指数

一、指数概览
2018年3月,万事达卡财新BBD中国新经济指数(NEI)录得31.3,即新经济投入占整个经济投入的比重为31.3%。2017年以来,NEI指数波动较大,按可比口径计算,本月NEI比上月上升1.5个百分点(图1)。本月NEI的上升主要来自科技投入的上升。

NEI新经济据于以下定义:首先,高人力资本投入、高科技投入、轻资产;其次,可持续的较快增长;第三,符合产业发展方向。NEI所含行业详见《万事达卡财新BBD中国新经济指数技术报告》与《万事达卡财新BBD中国新经济指数报告(2017年3月)》。
二、主要分项指标
NEI包括劳动力、资本和科技三项一级指标,它们在NEI中的权重分别是40%、35%和25%。2018年3月NEI的上升主要来自科技投入的上升。科技投入指数从2017年10月开始呈现震荡走势,本月指数录得33.6,环比上升3.9。资本投入指数从2017年9月以来呈缓慢上升趋势,本月指数录得33.1,环比上升1.4。劳动力投入指数自2017年7月以来持续下降,本月略有回升,环比上升0.1,指数录得28.3(图2)。

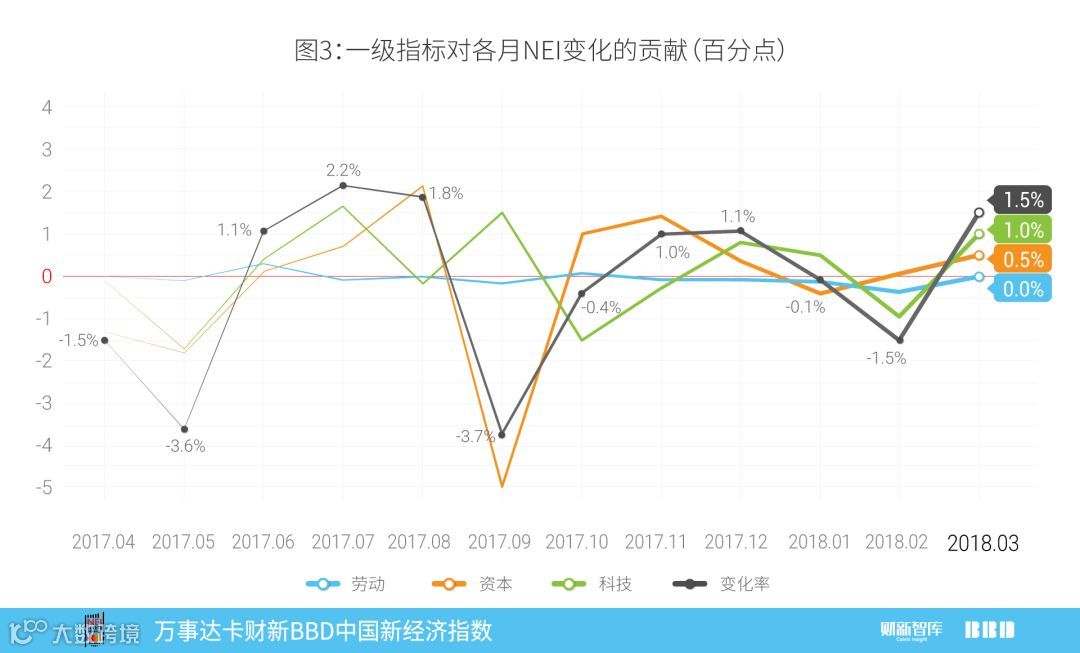
劳动力、资本和科技投入的变化绝对值分别为0.0,0.5,和1.0个百分点,与权重相乘求和后,对2018年3月NEI变化的贡献值为1.5(图3)。
分行业看,NEI中占比最大的行业为新一代信息技术与信息服务产业,2018年3月为总指数贡献了10个百分点;本月名次上升最快的行业为科学研究和技术服务业,贡献率为9.3个百分点,位列第二名;新能源产业贡献率排名下降最多,从上月的第六名下降至本月第九名,贡献率为0.5个百分点(图4)。

三、新经济就业
2018年3月,新经济行业入职平均工资水平环比下降,为每月10265元,较上月降低494元(图5)。新经济工资主要来自51job、智联招聘、拉钩、赶集网等数个招聘网站的招聘信息,即对劳动力的需求工资。

2018年3月新经济行业招聘人数占全国总招聘人数比例有所上升,为27.7%,同时新经济行业招聘总薪酬占全国总薪酬比重保持不变,仍为28.8%,这意味着新经济行业的平均入职工资水平相对于全国平均入职工资水平出现一定下降。
2018年3月新经济入职工资“溢价”为4.2%,低于上月4.4%(图6)。近几月新经济行业的平均工资溢价总体低于2017年上半年新经济行业的平均工资溢价。

四、从新增企业数据看投资行业变化
使用新增企业数据,我们对近两年来各行业新增企业占总新增企业比重进行了监测,结果见图7。


排名近两年持续上升的行业包括以下几类:建筑工程,2016年位列第25名,2017年上升到第21名,2018年继续上升到第12名,2017和2018年占比分别上升0.16%和0.18%,也是排名上升最多的行业;教育,2016年位列第20名,2017年上升到第17名,2018年继续上升到第15名,2017和2018年占比分别上升0.15%和0.07%;建筑,2016年位列第18名,2017年上升到第15名,2018年继续上升到第14名,2017和2018年占比分别上升0.22%和0.01%;汽车,2016年位列第14名,2017年上升到第13名,2018年继续上升到第11名,2017和2018年占比分别上升0.04%和0.01%。此外,工程、装饰、网络科技等行业在2017年排名上升,2018年排名保持不变。
排名近两年持续下降的行业包括以下几类:传播,2016年位列第13名,2017年下降到第20名,2018年继续下降到第21名,2017和2018年占比分别下降0.22%和0.00%;电子商务,2016年位列第10名,2017年下降到第12名,2018年继续下降到第16名,2017和2018年占比分别下降0.17%和0.07%。此外,房地产、文化产业在2017年排名下降,2018年排名保持不变。
排名在近两年之间波动变化的行业包括以下几类:餐饮,2016年位列第17名,2017年下降到第22名,2018年上升到第18名;文化传媒,2016年位列第22名,2017年上升到第18名,2018年下降到第20名;种植,2016年位列第28名,2017年上升到第14名,2018年下降到第22名。此外,物流、租赁、农业、建材、环保、管理等行业排名也在近两年上下波动;科技和商贸行业则在近两年排名保持不变,分别位列第一和第二名。
五、不同出口占比企业效率
本月,我们对比2017年和2018年新增就业和工资水平,探讨不同出口占比企业效率增长情况。不同出口占比企业两年间新增就业比例和工资水平如图8和图9所示。


2017年第一季度,出口占比较高的企业吸纳了较多的就业人口,并且支付了较高的平均工资,三者显示出一定的正相关性。2018年第一季度,两个指标在出口占比适中水平区间比较突出,反映出中等出口占比企业相对获得了较大幅度的就业增加和工资提升,换言之,他们效率上升最快。
经济学理论表明,出口企业的生产率相对高于非出口企业。中国情况刚好相反:出口企业生产率低于非出口企业,即存在中国出口企业的“生产率悖论”。我们发现,2018年第一季度,部分依赖出口的企业(出口占比在中间的企业)效率增长最快。这表明,出口占比最低的企业吸纳就业和工资水平均有限,中国当前不能仅靠内部消化产品来提高效率;出口占比最高的企业在提高效率表现也不尽如人意,以往“大进大出,来料加工”模式不能继续成为企业发展的方向。在当前中美贸易摩擦加剧的情况下,这一事实对于中国贸易策略的制定,具有一定的参考意义,特别的,我们要尽量规避可能的贸易战对出口占比居中的企业和行业的影响。
六、城市新经济排名
2018年3月新经济总量城市排名前20名如图10所示,北京、上海、广州、杭州、南京排名前五。该排序计算每个投入指标在所有城市中的排序百分位,再将百分位加权平均,体现的是近半年城市间新经济总量排名。

图11计算了2017年9月到2018年3月城市NEI平均排名,前五名为杭州、北京、上海、济南、深圳。

更多咨询敬请联络:
万事达卡
大中华区公共关系副总裁 吴焕宇
电话:+86-10-8519-9304
电邮:Huanyu_wu@mastercard.com
财新智库
财新智库高级经济学家 王喆
电话:+86-10-85905019
电邮:zhewang@caixin.com
公关总监 马玲
电话:+86-10-8590-5204
电邮:lingma@caixin.com
BBD(数联铭品)
BBD(数联铭品)首席经济学家 陈沁
电话:+86-28-65290823
电邮:chenqin@bbdservice.com
版权声明
万事达卡财新BBD中国新经济指数,是由财新智库(深圳)投资发展有限公司和成都数联铭品科技公司共同研发,与北京大学国家发展研究院合作,经过近一年努力,于2016年3月2日在北京首发的指数产品,此后每月2日上午10:00发布上月数据。
关于万事达卡:
万事达卡(纽交所股票交易代码:MA),www.mastercard.cn,是全球性的支付与科技公司。通过运营全球最快的支付处理网络,万事达卡将超过210个国家和地区的消费者、金融机构、商户、政府和企业连接在一起。万事达卡的产品和解决方案使得每个人在购物、旅行、企业经营、财务管理等日常商业活动都变得更容易、更安全和更高效。敬请关注我们的“万事达卡”官方微信以及在新浪的官方微博@万事达人,以获悉动态并参与互动。也可访问万事达卡新闻中心或万事达卡互动中心获取更多资讯。
关于财新:
财新传媒是提供财经新闻的全媒体集团,依托专业的团队和强大的原创新闻优势,以网站、移动端、期刊、视频、图书、会议等 多层次的业务平台,为中国最具影响力的受众群,提供准确、全面、深入的财经新闻产品。财新智库是财新传媒通过孵化另行建立的高端金融资讯服务平台,旨在通过发展金融数据业务,壮大宏观经济研究队伍,服务于智库业务客户。详细信息,敬请浏览 www.caixin.com。
关于BBD:
BBD(数联铭品)是行业领先的大数据解决方案提供商,紧密围绕新经济,通过动态尽调、信用评级、风险定价和经济指数四个步骤,BBD提供从微观到宏观的大数据服务。详细信息,敬请浏览:http://www.bbdservice.com。
March 2018
Mastercard Caixin BBD China New Economy Index

Overview
In March 2018, the Mastercard Caixin BBD New Economy Index (NEI) reading came in at 31.3, indicating that the New Economy accounted for 31.3% of overall economic input activities that month, up 1.5 ppts from February (Chart 1). The rising NEI was due to the increase of technology input. New economy is defined as following: 1) human capital intensive, technology intensive and capital light; 2) sustainable rapid growth, and 3) in line with the strategic new industries defined by the government. Please refer to our previous reports (March 2016 and March 2017) for the list of NEI sectors.

Primary Inputs
The NEI includes labor, capital and technology inputs that account for 40%, 35% and 25% of the total weights of the index, respectively. The rise in the March NEI reading came from the increase of technology inputs (Chart 2). Technology input index fluctuated widely since October 2017, coming in at 33.6, with 3.9 MoM increase. Capital investment showed a slow growth trend since September 2017. It continued to rise to 33.1 this month, with 1.4 MoM increase. Labor input index declined moderately since July 2017, increasing slightly to 28.3 this month, with 0.1 MoM increase.

Taking the weights into account, percentage changes in labor, capital and technology inputs were 0.0, 0.5, and 1.0 ppts, respectively. The net NEI change was 1.5 ppts in total (Chart 3).

Looking at the sectors, the New IT industry formed the largest proportion of the New Economy Index, contributing 10 ppts to NEI. Science Research and Hi-tech Services was the industry with fastest growth in March, contributing 9.3 ppts and ranking the second. New Energy came ninth from sixth, the biggest drop in ranking, contributing 0.5 ppts in March (Chart 4).

New Economy Employment
In March 2018, the average monthly entry level salary of the New Economy was RMB 10,265 per month, decreasing from last month’s level of RMB 10,759 (Chart 5). New Economy wage information is compiled from online websites of career platforms and recruitment services including 51job and Zhaopin, as well as other sites that list job demands.

Hiring in the New Economy sectors accounted for 27.7% of total hiring in March, slightly higher than the previous month’s 27.6%. At the same time, the total compensation share of New Economy sectors remained the same level as the previous month’s 28.8%, which meant the average entry salary level of New Economy was lower than national average entry wage level. The entry level salary premium of the New Economy was 4.2% as compared to economy-wide counterparts, decreasing from 4.4% in February (Chart 6). In the recent half year, the average salary premium of the New Economy was lower than the first half of 2017 generally.

Decomposition of Newly Established Enterprises
We use newly-established enterprises data to monitor new enterprises in sub-sectors (Chart 7).


Sub-sectors which were ranking up in last two consecutive years include the following: Architectural Engineering (No.25 in 2016, rising to No.21 and No.12 in 2017 and 2018, 0.16% and 0.18% increase in proportion in 2017 and 2018 respectively, the fastest growth sector in terms of ranking); Education (No. 20 in 2016, rising to No. 17 and No. 15 in 2017 and 2018, 0.15% and 0.07% increase in proportion in 2017 and 2018 respectively); Architecture (No. 18 in 2016, rising to No. 15 and No. 14 in 2017 and 2018, 0.22% and 0.01% increase in proportion in 2017 and 2018 respectively); Automobile (No. 14 in 2016, rising to No. 13 and No. 11 in 2017 and 2018, 0.04% and 0.01% increase in proportion in 2017 and 2018 respectively). Besides, Engineering, Decoration and IT’s ranks rose in 2017 and remained unchanged in 2018.
Sub-sectors which were ranking down in last two years include the following: Media (No. 13 in 2016, dropping to No. 20 and No. 21 in 2017 and 2018, 0.22% and 0.00% decrease in proportion in 2017 and 2018 respectively); E-commerce (No. 10 in 2016, dropping to No. 12 and No. 16 in 2017 and 2018, 0.17% and 0.07% decrease in proportion in 2017 and 2018 respectively). Besides, Real Estate and Culture’s rank dropped in 2017 and remained unchanged in 2018.
Sub-sectors fluctuating in ranking in last two years include the following: Catering (No.17 in 2017, dropped to No.22 in 2017 and rose to No 18 in 2018); Culture Media (No.22 in 2017, rose to No.18 in 2017 and dropped to No. 20 in 2018); Plantation (No.28 in 2017, rose to No.14 in 2017 and dropped to No 22 in 2018). Other subsectors with rank ups and downs were Logistics, Leasing, Agriculture, Building Materials, Environmental Protection and Management. Technology and Business Industry kept ranking No.1 and No.2 respectively in last two years.
Efficiency of Enterprises with Difference in Export Dependency
This month we explore the business efficiency change of enterprises with different export dependency based on data in new employment (Chart 8) and salary level (Chart 9) in 2017 and 2018.


In the first quarter of 2017, the enterprises which were more export oriented added more new jobs and offered higher salaries. Positive correlations were found among export dependence, new employment, and wage level. In the first quarter of 2018, it was enterprises with medium export dependence that paid higher salaries and had higher shares of new employment, whose efficiency rose the fastest.
Empirical economic studies show that exporters’ productivity is relatively higher than that of non-exporters. While in China the opposite is true: the productivity of exporting enterprises is relatively lower, which is so-called productivity paradox of Chinese exporters.
Our data indicates that enterprises partly reliant on exports (i.e. enterprises with medium export dependence) had the largest efficiency growth in the first quarter of 2018. In other words, enterprises with the lowest export dependency were mediocre new job and competitive salary providers and it is hard to improve business efficiency in autarky. At the same time, enterprises with the highest export dependency didn’t perform well in new employment creation and labor productivity and the previous “Large Import and Export, Processing Trade” mode has become outdated. Our findings might be helpful in trade policy constructions and response to current Sino-US Trade Frictions. China government should avoid harming enterprises with medium export dependency who are main drivers of business efficiency improvement.
City Rankings of the New Economy
Based on overall New Economy rankings, the top twenty cities were shown in Chart 10. The top five cities were Beijing, Shanghai, Guangzhou, Hangzhou, and Nanjing. Rankings are based on a weighted average of the percentile rank of indicators for the city in the past 6 months.

Chart 11 showed the average NEI city rankings between September 2017 and March 2018. The top five cities were Hangzhou, Beijing, Shanghai, Ji’nan and Shenzhen.

For further information please contact:
Mastercard
Mr. Wu Huanyu, Director, Communications
Tel:+86-10-8519-9304
Email:Huanyu_wu@mastercard.com
Caixin Insight Group
Dr. Wang Zhe, Senior Economist
Tel:+86-10-85905019
Emails:zhewang@caixin.com
Ma Ling, Public Relations
Tel:+86-10-8590-5204
Email:lingma@caixin.com
BBD
Dr. Chen Qin, Chief Economist
Tel:+86-28-65290823
Emails:chenqin@bbdservice.com
The Mastercard Caixin BBD China New Economy Index is the fruit of a research partnership between Caixin Insight Group and BBD, in collaboration with the National Development School, Peking University. The subject of a year of research, the NEI was first publically released on March 2, 2016 and will be issued the 2nd of every month at 10:00am China Standard Time.
About Caixin
Caixin Media is China's leading media group dedicated to providing financial and business news through periodicals, online content, mobile applications, conferences, books and TV/video programs. Caixin Media aims to blaze a trail that helps traditional media prosper in the new media age through integrated multimedia platforms. Caixin Insight Group is a high-end financial data and analysis platform. For more information, please visitwww.caixin.com.
About Mastercard
Mastercard (NYSE: MA), www.mastercard.com, is a technology company in the global payments industry. We operate the world’s fastest payments processing network, connecting consumers, financial institutions, merchants, governments and businesses in more than 210 countries and territories. Mastercard’s products and solutions make everyday commerce activities – such as shopping, traveling, running a business and managing finances – easier, more secure and more efficient for everyone. Follow us on Twitter @MastercardAP and @MastercardNews, join the discussion on the Beyond the Transaction Blog and subscribe for the latest news on the Engagement Bureau.
About BBD (Business Big Data)
BBD is a leading Big Data and quantitative business analytics firm specializing in the analysis of the high-growth industries emerging in Mainland China. Through dynamic data tracking, credit analysis, risk pricing and economic index construction, BBD provides its clients with a wide range of services at both the macro and micro level. For more information, please visit http://www.bbdservice.com/.
