
裕元集團
Yue Yuen Industrial Holdings
(0551 HK)
預計FOB價格有望保持正增
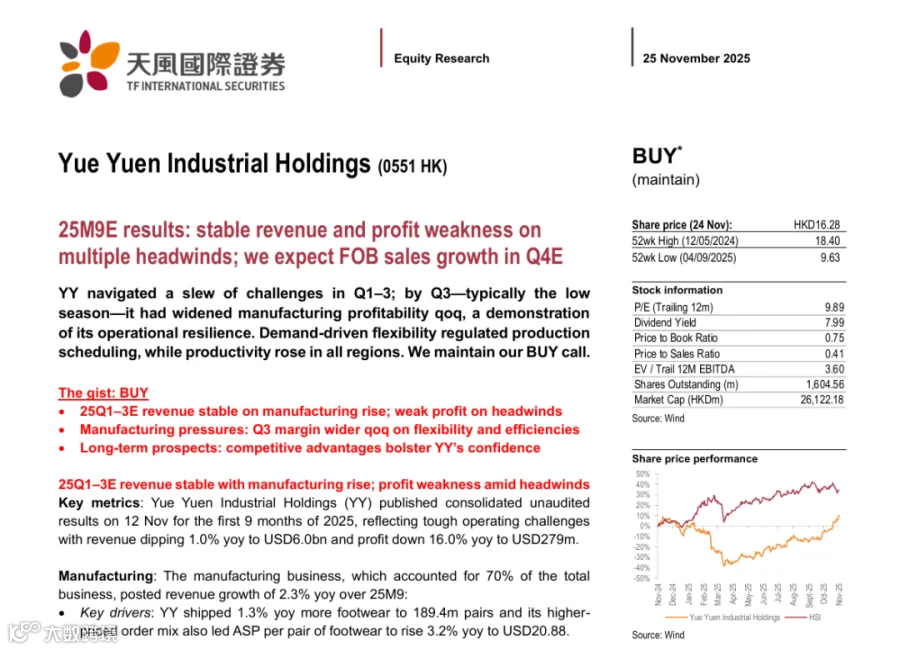
25M9E results: stable revenue and profit weakness on multiple headwinds; we expect FOB sales growth in Q4E
|
買入(維持評級) BUY (maintain) 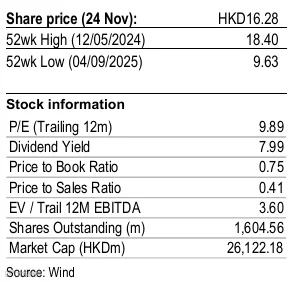
|
投資要點/Investment Thesis
投資要點/Investment Thesis
公司發佈2025年九個月營運概要
25M9公司營業收入同比下降1.0%至6,017.4百萬美元,其中製造業務營收同比增長2.3%; 鞋履出貨量同比增長1.3%至189.4百萬雙,受益於優質的訂單組合,平均售價同比上升3.2%至每雙20.88美元。
製造業務毛利率同比下降1.3個百分點至18.3%,主要由於各個製造廠區的產能負載不均、部分生產線生產效率未達設定標準,加上在各地新增人力及薪資上漲,推高人工成本。
來自寶勝貢獻的營業收入較去年同期的1,939.8百萬美元下降7.9%至1,785.7百萬美元。以人民幣(寶勝的申報貨幣)計算,營業收入較去年同期的人民幣13,984.2百萬元下降7.7%至人民幣12,902.8百萬元。
盈利能力按季提升、利潤率改善
2025年第三季度,製造業務展現其經營韌性,雖受淡季影響盈利能力按季仍有提升。全球消費景氣呈現穩健發展,美國市場返校季銷售優於預期,然而新一輪的關稅政策及地緣政治動盪繼續帶來不確定性,導致經營環境面臨諸多挑戰。因應複雜多變的全球經濟格局,品牌客戶採購策略更趨謹慎,加上2024年第三季度表現異常強勁所產生的高基期效應,出貨量因此同比下降。
儘管面臨對等關稅相關負面影響,第三季度公司的優質訂單組合繼續推升平均單價,部分抵銷出貨量下跌對製鞋營收的負面影響。我們預計,四季度FOB仍有望保持正增。
部分製造產區的訂單滿單率及產能利用率與均值差異顯著,造成產能負載不均情況,併產生額外加班需求及其他無效成本。製造業務人數按年上升4.4%,加上各地薪資上漲高單位數百分比,大幅推高人工成本。上述因素對製造業務的短期盈利能力產生負面影響,其中第三季度雖受淡季影響,產能利用率環比下降,但公司秉持需求導向的生產規劃策略,並強化產能調度彈性,有助平衡生產排程,加上各區產效提升,推動第三季度利潤率按季改善。
對長期前景保持樂觀
近年運動休閒趨勢持續升溫,帶動多個領導品牌客戶締造良好業績,而隨著二零二六年國際足聯世界盃、亞洲運動會及冬季奧林匹克運動會等多項國際體育盛事陸續舉行,預期全球對運動與健康意識的關注將持續提升,併為相關產業及領域注入長期增長動能。 公司對運動行業的長期前景保持樂觀,亦對其策略性供應商的角色及高階鞋履開發實力充滿信心,有助鞏固其與國際領導品牌的永續夥伴關係。
YY navigated a slew of challenges in Q1–3; by Q3—typically the low season—it had widened manufacturing profitability qoq, a demonstration of its operational resilience. Demand-driven flexibility regulated production scheduling, while productivity rose in all regions. We maintain our BUY call.
The gist: BUY
25Q1–3E revenue stable on manufacturing rise; weak profit on headwinds
Manufacturing pressures: Q3 margin wider qoq on flexibility and efficiencies
Long-term prospects: competitive advantages bolster YY’s confidence
25Q1–3E revenue stable with manufacturing rise; profit weakness amid headwinds
Key metrics: Yue Yuen Industrial Holdings (YY) published consolidated unaudited results on 12 Nov for the first 9 months of 2025, reflecting tough operating challenges with revenue dipping 1.0% yoy to USD6.0bn and profit down 16.0% yoy to USD279m.
Manufacturing: The manufacturing business, which accounted for 70% of the total business, posted revenue growth of 2.3% yoy over 25M9:
Key drivers: YY shipped 1.3% yoy more footwear to 189.4m pairs and its higherpriced order mix also led ASP per pair of footwear to rise 3.2% yoy to USD20.88.
Gross margin: GPM narrowed 1.3ppt yoy to 18.3%, with capacity utilizations uneven across the company’s various facilities, as some production lines underperformed efficiency targets. In addition, labor costs went up with new hires and wage increases in several areas.
Retail: YY’s retail subsidiary Pou Sheng posted a revenue decline of 7.9% to USD1. 8bn in 25M9 (from USD1.9bn in 24M9); in RMB terms (Pou Sheng’s reporting currency), its revenue fell 7.7% to RMB12.9bn, vs RMB14.0bn in 24M9.
Manufacturing pressures: wider Q3 margin qoq on flexible schedules, efficiencies
YY underwent multiple pressures through Q1–3, but in Q3—typically the low season—it managed to expand manufacturing profitability qoq, a demonstration of its resilience. However, shipment growth declined in yoy terms, because 24Q3, being an exceptional quarter, provided a tough comparison. Although the qoq lower capacity utilization in Q3 was seasonal, YY’s demand-driven production planning strategy enhanced production scheduling flexibility and helped smooth its production schedules. Another factor that contributed to a qoq wider margin was improved productivity across all manufacturing regions. Below, we relook at the multiple factors in play through the first 9 months:
Q1–3: confluence of factors dampened short-term profitability:
Uneven production loads: Certain manufacturing areas severely underperformed average order fulfillment and capacity utilization rates during the first 9 months. To manage the uneven production loads and other inefficiencies, labor cost rose as other teams took up the slack and overtime pay went up.
New hires and wage increases: Labor cost rose substantially as the company expanded manufacturing head count by 4.4% yoy in the period, along with a highsingle-digit percentage wage rise in many regions.
Q3: managing the pressures to effect improvements:
Macro pressures: On one hand, better-than-expected back-to-school sales in the US did spur global consumer market growth; but on the other hand, new US tariff policies and geopolitical instabilities continued to add uncertainties to the volatile market mix. Hence, cautious brand customers maintained conservative procurement strategies to navigate the complex global economic landscape.
More premium order mix: In the face of negative impacts from retaliatory US tariffs, YY effected a higher-end order mix in Q3, which lifted ASP and mitigated the impact of declining shipment volume on footwear revenue. For the current quarter in Q4E, we expect sales on a free-on-board basis will maintain the growth trend.
Near to long-term prospects: competitive advantages bolster YY’s confidence
Near-term view: The rise of sports and leisure trends in recent years has led many of YY’s leading brand customers to deliver strong results. In view of major events on the upcoming international sporting calendar—the 2026 FIFA World Cup, Asian Games and Winter Olympic Games—we expect sports and health consumer momentum will continue to drive the market.
Long-term view: YY is bullish about long-term growth prospects for the sports industry, which would spill over to sports related sectors and segments. The company believes it has two key competitive advantages that will continue to reinforce its partnerships with leading global brands: its role as a strategic supplier and its capability in developing premium footwear for customers.
投資建議/Investment Ideas
調整盈利預測,維持買入評級
考慮消費弱增長和關稅影響,我們小幅調整盈利預測。 預計公司25-27年營收為82億美元、86億美元、91億美元(原值為83億美元、88億美元、94億美元); 歸母凈利分別為3.7億美元、4.1億美元、4.6億美元(原值為4.0億美元、4.3億美元、4.8億美元); 對應PE分別為9x、8x、7x。
Valuation and risks
Factoring in weak consumer market growth and the tariff impacts, we tweaked lower our 2025/26/27E forecasts to revenue of USD8.2bn/8.6bn/9.1bn (from USD8.3bn/8.8bn/9.4bn) and net profit of USD370m/410m/460m (from USD400m/430m/480m), bringing our PE to 9x/8x/7x. We continue to have a BUY rating on the stock.
風險提示:消費景氣度不及預期,關稅變化,產能爬坡進度不及預期,市場競爭激烈等。
Risks include: weaker-than-expected consumer demand; adverse US tariff policy changes; production capacity ramping up more slowly than expected; and intensifying competition.
Email: research@tfisec.com
TFI research report website:
(pls scan the QR code)

本文件由天風國際證券集團有限公司, 天風國際證券與期貨有限公司(證監會中央編號:BAV573)及天風國際資產管理有限公司(證監會中央編號:ASF056)(合稱“天風國際集團”)編制,所載資料可能以若干假設為基礎,僅供作非商業用途及參考之用途,會因經濟、市場及其他情況而隨時更改而毋須另行通知。任何媒體、網站或個人未經授權不得轉載、連結、轉貼或以其他方式複製發表本檔及任何內容。已獲授權者,在使用本檔或任何內容時必須注明稿件來源於天風國際集團,並承諾遵守相關法例及一切使用的國際慣例,不為任何非法目的或以任何非法方式使用本檔,違者將依法追究相關法律責任。本檔所引用之資料或資料可能得自協力廠商,天風國際集團將盡可能確認資料來源之可靠性,但天風國際集團並不對協力廠商所提供資料或資料之準確性負責。且天風國際集團不會就本檔所載任何資料、預測及/或意見的公平性、準確性、時限性、完整性或正確性,以及任何該等預測及/或意見所依據的基準作出任何明文或暗示的保證、陳述、擔保或承諾而負責或承擔任何法律責任。本檔中如有類似前瞻性陳述之內容,此等內容或陳述不得視為對任何將來表現之保證,且應注意實際情況或發展可能與該等陳述有重大落差。本檔並非及不應被視為邀約、招攬、邀請、建議買賣任何投資產品或投資決策之依據,亦不應被詮釋為專業意見。閱覽本文件的人士或在作出任何投資決策前,應完全瞭解其風險以及有關法律、賦稅及會計的特點及後果,並根據個人的情況決定投資是否切合個人的投資目標,以及能否承擔有關風險,必要時應尋求適當的專業意見。投資涉及風險。敬請投資者注意,證券及投資的價值可升亦可跌,過往的表現不一定可以預示日後的表現。在若干國家,傳閱及分派本檔的方式可能受法律或規例所限制。獲取本檔的人士須知悉及遵守該等限制。