
-
Power Platform for Enterprise: Overcoming Email Throttling with Innovative Load Balancing | LinkedIn
-
The Million-Request Problem: A Power Automate Performance Deep Dive | LinkedIn


-
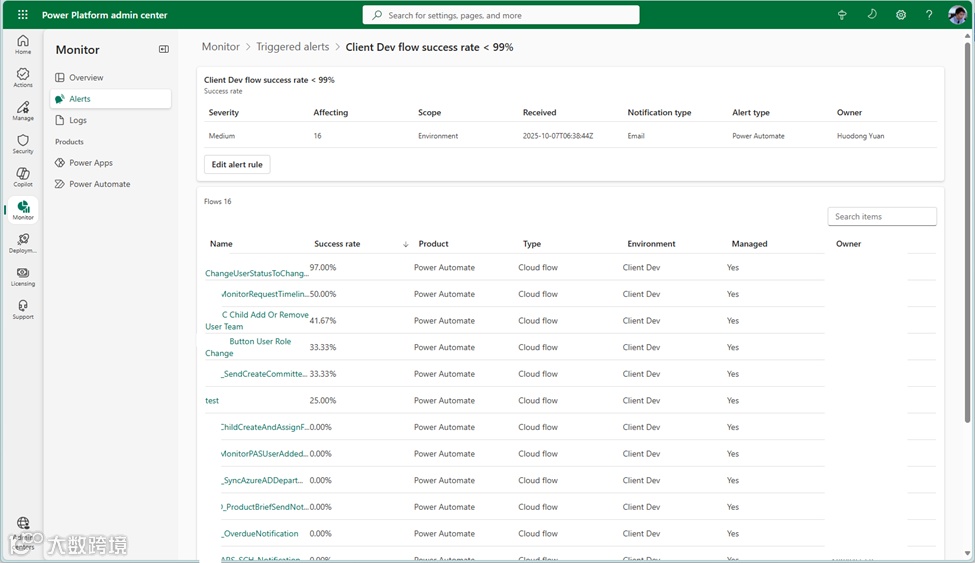
Product: Power Automate -
Product type: Cloud flow -
Scope: Environment -
Environment: Client Dev -
Condition: Metric Success rate Is Under 99 (Note: the unit for this condition is percentage) -
Severity: Medium -
Notification type: Email
-
产品:Power Automate -
产品类型:云流 -
范围:环境 -
环境:客户端开发环境 -
条件:指标 “成功率” 低于 99(注:此条件的单位是百分比) -
严重程度:中 -
通知类型:电子邮件 
-
Product and Product type: Power Apps – Canvas app -
Scope: Environment – Client Dev -
Condition: Metric “Time to full load (P75)” Is Over 5 (P.S. the unit here is second.) -
产品及产品类型:Power Apps - 画布应用程序 -
范围:环境 - 客户端开发环境 -
条件:指标 “完全加载时间(P75)” 超过 5(注:此处单位为秒)


-
Product: Power Apps -
Product type: Canvas app -
Scope: Environment -
Environment: Client Dev -
Condition: Metric “App open success rate” Is Under 100 (P.S. the unit here is %) -
产品:Power Apps -
产品类型:画布应用程序 -
范围:环境 -
环境:客户端开发环境 -
条件:指标 “应用打开成功率” 低于 100(注:此处单位为 %)


-
Power Platform Solutions Architect -
Power Platform Functional Consultant -
Power Platform Developer -
Power BI Data Analyst -
Power Automate RPA Developer -
Azure Solutions Architect -
Azure DevOps Engineer -
Cybersecurity Architect