今天分享下如何配置 prometheus 的 agent 模式
参考文档:
https://prometheus.io/docs/prometheus/latest/feature_flags/
https://prometheus.io/blog/2021/11/16/agent/
一. 使用场景
解决当只有prometheus核心节点做采集时高内存的问题,可以用来减轻 prometheus server 的压力。
二. 架构

三. 注意事项
1.在prometheus开启agent模式时,仅负责抓取和转发指标。
2.prometheus.yml中必须配置“remote_write”
3.prometheus.yml中不能配置alertmanager和rules,添加alertmanager和rules在启动时会报错!
4.默认关闭其 UI 查询能力,无法在UI上查询数据。
5.本地不存储数据,也不能查询本地数据,所以下面这些启动参数也不能使用,添加会无法启动
·-storage.tsdb.path:指定本地 TSDB 存储路径。Agent 模式不存储数据,无需配置存储路径,因此该参数无效。
·-storage.tsdb.retention:指定本地数据保留时间。同理,Agent 模式不本地存储数据,无需设置保留时间。
·-query.max-concurrency:限制并发查询的最大数量。Agent 模式不提供查询功能(无查询接口),因此该参数无意义。
四. 配置过程
1.启动时添加--enable-feature=agent参数
prometheus-agent:
# LTS版本
image: prom/prometheus:v2.53.5
container_name: "prometheus-agent"
restart: always
user: root
ports:
- "19090:9090"
volumes:
- ${PWD}/prometheus/data:/prometheus #数据目录
- ${PWD}/prometheus/conf/:/etc/prometheus #配置文件目录
- /etc/localtime:/etc/localtime
command:
- "--config.file=/etc/prometheus/prometheus.yml"
- "--log.level=info"
- "--web.enable-lifecycle"
- "--web.enable-remote-write-receiver"
- "--enable-feature=agent" # 关键配置
networks:
- monitor
...
2.在核心 prometheus server中添加--web.enable-remote-write-receiver参数,允许远程web写入
prometheus:
# LTS版本
image: prom/prometheus:v2.53.5
container_name: "prometheus"
restart: always
user: root
ports:
- "9090:9090"
volumes:
- ${PWD}/prometheus/data:/prometheus #数据目录
- ${PWD}/prometheus/conf/:/etc/prometheus #配置文件目录
- ${PWD}/prometheus/conf/rules.d:/etc/prometheus/rules.d #告警规则配置文件
- ${PWD}/prometheus/conf/file-sd-configs:/etc/prometheus/file-sd-configs #自动发现文件存放目录
- /etc/localtime:/etc/localtime
command:
- "--config.file=/etc/prometheus/prometheus.yml"
- "--web.config.file=/etc/prometheus/config.yml"
- "--log.level=info"
- "--web.listen-address=0.0.0.0:9090"
- "--storage.tsdb.path=/prometheus"
- "--storage.tsdb.retention=3d"
- "--web.enable-lifecycle"
- "--web.enable-remote-write-receiver" # 关键配置
networks:
- monitor
...
3.在agent的配置文件prometheus.yml中指定远程核心的prometheus的URL
global:
scrape_interval: 10s
evaluation_interval: 10s
remote_write:
# 写入VictoriaMetrics server
- url: http://192.168.31.103:8428/api/v1/write
# 可选:添加认证(若 VictoriaMetrics 启用了 HTTP 基础认证)
basic_auth:
username: xxx
password: xxxxxx
# 可选:添加额外标签(用于区分不同 Prometheus 实例的写入数据)
write_relabel_configs:
- source_labels: [__name__]
target_label: prometheus_instance
replacement: "wuqy-prom-agent"# 自定义标签值
# 写入 prometheus server
- url: https://192.168.31.103:9090/api/v1/write
# 跳过证书验证
tls_config:
insecure_skip_verify: true
# 可选:添加认证(若 prometheus 启用了 HTTP 基础认证)
basic_auth:
username: xxx
password: xxxxxx
# 可选:添加额外标签(用于区分不同 Prometheus 实例的写入数据)
write_relabel_configs:
- source_labels: [__name__]
target_label: prometheus_instance
replacement: "wuqy-prom-agent"# 自定义标签值
scrape_configs:
- job_name: "prometheus-agent"
scrape_interval: 5s
static_configs:
- targets: ["localhost:9090"]
4.启动后可以访问下 web UI

可以看到首页就有相关提示:
此 Prometheus 实例运行在代理模式下。在这种模式中,Prometheus 仅用于抓取已发现的目标,并将抓取到的指标转发至远程写入端点。一些功能在此模式下不可用,例如查询和告警。
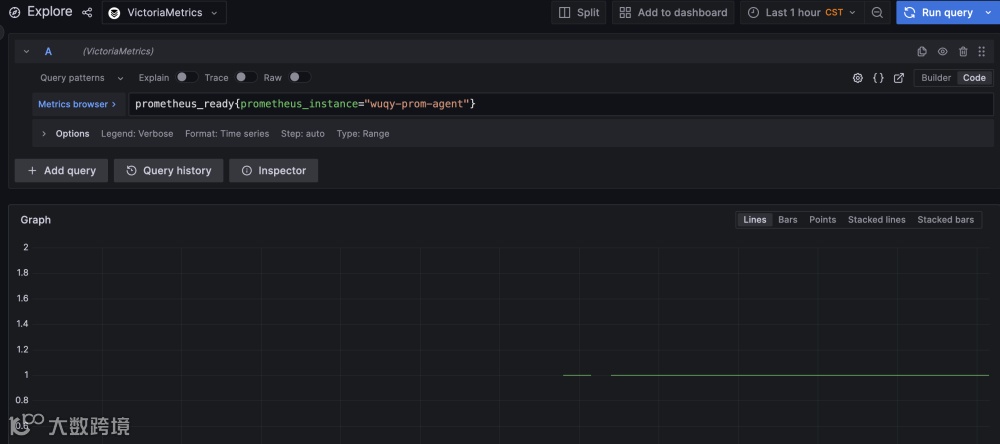
5.到核心 prometheus 或者 vm 上查询指标测试
比如:
prometheus_ready{prometheus_instance="wuqy-prom-agent"}