
本文是《量化指标解码》系列的第2篇,我们将深入解码RSI指标的每一个细节,从计算原理到实战应用,从常规用法到高级技巧,让你真正掌握这个最经典的技术指标。
写在前面
在上一篇文章中,我给K线图表的技术指标装上了"AI大脑",让它们能够开口说话,用人话告诉你市场状态、交易信号和操作建议。
当时,我以RSI指标为例,展示了智能解读的整体架构和实现思路。文章发布后,有不少朋友留言说,虽然看到了RSI的智能解读效果,但对RSI指标本身还是一知半解:
-
RSI到底是怎么计算出来的? -
为什么超买是70,超卖是30?能不能调整? -
RSI背离是什么?怎么判断? -
RSI钝化又是什么情况?如何应对? -
实战中应该怎么用RSI?
说实话,这些问题问得都非常好。技术指标的智能解读固然重要,但如果不理解指标的底层原理和应用场景,就很难真正用好它。
所以,我决定写这篇文章,把RSI指标从里到外、从上到下,彻彻底底地讲清楚。
这不是一篇简单的科普文章,而是一篇实战导向的深度教程。我会:
-
用最简单的语言解释RSI的计算原理 -
用实际的代码展示如何实现RSI -
用真实的案例说明RSI的各种用法 -
分享我在实战中踩过的坑和经验
准备好了吗?让我们一起深入RSI的世界!
一、RSI的原理:从涨跌幅到相对强弱
1.1 RSI是什么?
RSI(Relative Strength Index),中文名叫"相对强弱指标",是由威尔斯·怀尔德(Welles Wilder)在1978年提出的。
它的核心思想非常简单:通过比较一段时间内价格上涨和下跌的幅度,来判断市场的超买超卖状态。
举个例子:
-
如果过去14天,价格涨了10天,跌了4天,涨幅远大于跌幅,说明买盘很强,RSI就会很高(可能在70以上) -
如果过去14天,价格涨了4天,跌了10天,跌幅远大于涨幅,说明卖盘很强,RSI就会很低(可能在30以下)
1.2 RSI的计算公式
RSI的计算公式看起来有点复杂,但理解起来其实不难:
RSI = 100 - (100 / (1 + RS))
其中:
RS = 平均涨幅 / 平均跌幅
具体步骤:
-
计算每日涨跌幅
-
如果今天收盘价 > 昨天收盘价,涨幅 = 今天收盘价 - 昨天收盘价,跌幅 = 0 -
如果今天收盘价 < 昨天收盘价,跌幅 = 昨天收盘价 - 今天收盘价,涨幅 = 0 -
如果今天收盘价 = 昨天收盘价,涨幅 = 0,跌幅 = 0 -
计算平均涨跌幅
-
平均涨幅 = 过去N天涨幅的平均值 -
平均跌幅 = 过去N天跌幅的平均值 -
N通常取14 -
计算RS和RSI
-
RS = 平均涨幅 / 平均跌幅 -
RSI = 100 - (100 / (1 + RS))
1.3 一个简单的例子
假设我们计算最近5天的RSI(为了简化,实际中通常用14天):
|
|
|
|
|
|---|---|---|---|
|
|
|
|
|
|
|
|
|
|
|
|
|
|
|
|
|
|
|
|
|
|
|
|
|
计算:
-
平均涨幅 = (2 + 3 + 0 + 3) / 4 = 2 -
平均跌幅 = (0 + 0 + 2 + 0) / 4 = 0.5 -
RS = 2 / 0.5 = 4 -
RSI = 100 - (100 / (1 + 4)) = 100 - 20 = 80
RSI = 80,说明市场处于超买状态。
1.4 RSI的取值范围和含义
RSI的取值范围是0-100,通常我们这样理解:
|
|
|
|
|---|---|---|
|
|
|
|
|
|
|
|
|
|
|
|
|
|
|
|
|
|
|
|
|
|
|
|
|
|
|
|
注意:这些阈值不是固定的,可以根据不同的市场和品种进行调整。
二、代码实现:如何用Python计算RSI
理论讲完了,让我们看看如何用代码实现RSI。
2.1 使用TA-Lib计算RSI
在ATMQuant项目中,我们使用TA-Lib库来计算RSI,这是最简单也最可靠的方法:
import talib
import numpy as np

def calculate_rsi(close_prices: list, period: int = 14) -> list:
    """
    计算RSI指标

    Args:
        close_prices: 收盘价序列
        period: RSI周期,默认14

    Returns:
        RSI值序列
    """
    # 转换为numpy数组
    close_array = np.array(close_prices)

    # 使用TA-Lib计算RSI
    rsi_array = talib.RSI(close_array, timeperiod=period)

    return rsi_array.tolist()
2.2 在ATMQuant中的实际应用
在我们的ATMQuant项目中,RSI的计算被封装在RsiItem类中,并且增加了缓存机制以提高性能:
# core/charts/rsi_item.py

class RsiItem(ChartItem, ConfigurableIndicator):
    """RSI相对强弱指标"""

    def __init__(self, manager: BarManager, rsi_window: int = 14,
                 rsi_long_threshold: float = 70,
                 rsi_short_threshold: float = 30):
        """初始化RSI指标"""
        super().__init__(manager)

        # 参数设置
        self.rsi_window = rsi_window
        self.rsi_long_threshold = rsi_long_threshold
        self.rsi_short_threshold = rsi_short_threshold

        # 数据缓存(重要!提高性能)
        self.rsi_data: Dict[int, float] = {}

    def get_rsi_value(self, ix: int) -> float:
        """获取RSI值(带缓存)"""
        if ix < 0:
            return50# 默认值

        # 如果缓存中有,直接返回
        if ix in self.rsi_data:
            return self.rsi_data[ix]

        # 否则重新计算
        bars = self._manager.get_all_bars()
        close_data = [bar.close_price for bar in bars]
        rsi_array = talib.RSI(np.array(close_data), self.rsi_window)

        # 更新缓存
        for n, value in enumerate(rsi_array):
            ifnot np.isnan(value):
                self.rsi_data[n] = value

        return self.rsi_data.get(ix, 50)
关键点:
-
使用字典缓存已计算的RSI值,避免重复计算 -
当新K线到来时,只清除最近几个数据点的缓存 -
支持参数配置(周期、超买超卖阈值)
三、RSI的经典用法:超买超卖与背离
现在你已经理解了RSI的原理和计算方法,让我们看看在实战中如何使用RSI。
3.1 超买超卖信号
这是RSI最基础也是最常用的功能。
超买信号(RSI > 70):
-
市场可能过热,价格短期内上涨过快 -
可能面临回调压力 -
操作建议:考虑减仓或止盈
超卖信号(RSI < 30):
-
市场可能超跌,价格短期内下跌过快 -
可能出现反弹机会 -
操作建议:关注建仓机会
让我看看在代码中如何实现这个判断:
def analyze_rsi_overbought_oversold(rsi_value: float,
                                   overbought_threshold: float = 70,
                                   oversold_threshold: float = 30) -> str:
    """
    分析RSI超买超卖状态

    Args:
        rsi_value: RSI值
        overbought_threshold: 超买阈值
        oversold_threshold: 超卖阈值

    Returns:
        分析结果文本
    """
    if rsi_value >= 80:
        return"极度超买 - 强烈卖出信号,风险提示: 短期回调概率极大"
    elif rsi_value >= overbought_threshold:
        return"超买区域 - 谨慎做多,操作建议: 考虑分批减仓"
    elif rsi_value <= 20:
        return"极度超卖 - 强烈买入信号,机会提示: 短期反弹概率极大"
    elif rsi_value <= oversold_threshold:
        return"超卖区域 - 关注做多,操作建议: 可分批建仓"
    elif45 <= rsi_value <= 55:
        return"中性区域 - 观望为主,策略: 等待明确突破信号"
    elif rsi_value > 55:
        return"偏强区域 - 多头占优,策略: 回调做多,注意止盈"
    else:
        return"偏弱区域 - 空头占优,策略: 反弹做空,注意止损"


# 示例
print(analyze_rsi_overbought_oversold(75))
# 输出: 超买区域 - 谨慎做多,操作建议: 考虑分批减仓

print(analyze_rsi_overbought_oversold(25))
# 输出: 超卖区域 - 关注做多,操作建议: 可分批建仓
实战经验:
-
不要单纯依赖RSI超买超卖信号开仓或平仓 -
在强趋势行情中,RSI可能长期处于超买或超卖区域(这就是"钝化") -
最好结合其他指标(如MACD、均线)一起判断
3.2 RSI背离:顶背离与底背离
背离是RSI最强大的功能之一,它可以提前预警趋势反转。
什么是背离?
顶背离(看跌信号):
-
价格创新高,但RSI没有创新高 -
说明虽然价格还在涨,但上涨动能已经减弱 -
可能出现回调或反转
底背离(看涨信号):
-
价格创新低,但RSI没有创新低 -
说明虽然价格还在跌,但下跌动能已经减弱 -
可能出现反弹或反转
如何判断背离?
让我用代码展示背离的判断逻辑:
def detect_rsi_divergence(prices: list, rsi_values: list,
                         lookback: int = 10) -> dict:
    """
    检测RSI背离

    Args:
        prices: 价格序列
        rsi_values: RSI序列
        lookback: 回看周期

    Returns:
        背离信息字典
    """
    result = {
        'bull_divergence': False,  # 底背离(看涨)
        'bear_divergence': False,  # 顶背离(看跌)
        'description': ''
    }

    if len(prices) < lookback * 2:
        return result

    # 获取最近的数据
    recent_prices = prices[-lookback:]
    recent_rsi = rsi_values[-lookback:]

    # 获取历史对比数据
    history_prices = prices[-lookback*2:-lookback]
    history_rsi = rsi_values[-lookback*2:-lookback]

    # 检测顶背离
    if max(recent_prices) > max(history_prices):  # 价格创新高
        if max(recent_rsi) < max(history_rsi):  # 但RSI没有创新高
            result['bear_divergence'] = True
            result['description'] = '检测到顶背离 - 看跌反转信号,策略: 等待价格确认后做空'

    # 检测底背离
    if min(recent_prices) < min(history_prices):  # 价格创新低
        if min(recent_rsi) > min(history_rsi):  # 但RSI没有创新低
            result['bull_divergence'] = True
            result['description'] = '检测到底背离 - 看涨反转信号,策略: 等待价格确认后做多'

    return result


# 示例:模拟一个顶背离场景
prices = [100, 105, 110, 108, 112, 115, 113, 117, 120, 118, 122]  # 价格创新高
rsi_values = [60, 65, 70, 68, 72, 75, 73, 74, 72, 70, 71]  # RSI没创新高

divergence = detect_rsi_divergence(prices, rsi_values, lookback=5)
if divergence['bear_divergence']:
    print(divergence['description'])
    # 输出: 检测到顶背离 - 看跌反转信号,策略: 等待价格确认后做空
在ATMQuant中的实现
在我们的图表系统中,背离信号会用不同颜色的连线标注出来:
# core/charts/rsi_item.py

class RsiItem(ChartItem, ConfigurableIndicator):
    """RSI指标,支持背离检测"""

    def __init__(self, manager: BarManager):
        super().__init__(manager)

        # 背离数据
        self.start_bull_indices = []  # 底背离起点
        self.end_bull_indices = []    # 底背离终点
        self.start_bear_indices = []  # 顶背离起点
        self.end_bear_indices = []    # 顶背离终点

        # 颜色配置
        self.gold_pen = pg.mkPen(color=(252, 173, 4), width=5)  # 顶背离用金色
        self.purple_pen = pg.mkPen(color=(128, 0, 128), width=5)  # 底背离用紫色

    def add_divergence_pairs(self, bull_divergence_pairs, bear_divergence_pairs):
        """添加背离对(由策略传入)"""
        self.start_bull_indices = [pair[1] for pair in bull_divergence_pairs]
        self.end_bull_indices = [pair[0] for pair in bull_divergence_pairs]
        self.start_bear_indices = [pair[1] for pair in bear_divergence_pairs]
        self.end_bear_indices = [pair[0] for pair in bear_divergence_pairs]

    def _draw_bar_picture(self, ix: int, bar: BarData) -> QtGui.QPicture:
        """绘制RSI(包括背离线)"""
        picture = QtGui.QPicture()
        painter = QtGui.QPainter(picture)

        # ... 绘制RSI线的代码 ...

        # 绘制底背离线(紫色)
        if ix in self.start_bull_indices:
            start_index = self.start_bull_indices.index(ix)
            if start_index < len(self.end_bull_indices):
                end_index = self.end_bull_indices[start_index]
                start_rsi = self.get_rsi_value(ix)
                end_rsi = self.get_rsi_value(end_index)

                painter.setPen(self.purple_pen)
                painter.drawLine(
                    QtCore.QPointF(ix, start_rsi),
                    QtCore.QPointF(end_index, end_rsi)
                )

        # 绘制顶背离线(金色)
        if ix in self.start_bear_indices:
            start_index = self.start_bear_indices.index(ix)
            if start_index < len(self.end_bear_indices):
                end_index = self.end_bear_indices[start_index]
                start_rsi = self.get_rsi_value(ix)
                end_rsi = self.get_rsi_value(end_index)

                painter.setPen(self.gold_pen)
                painter.drawLine(
                    QtCore.QPointF(ix, start_rsi),
                    QtCore.QPointF(end_index, end_rsi)
                )

        painter.end()
        return picture
视觉效果:
-
底背离:紫色连线,连接两个RSI低点 -
顶背离:金色连线,连接两个RSI高点
3.3 RSI钝化:强趋势中的特殊现象
钝化是RSI在实战中最容易踩坑的地方。
什么是钝化?
-
高位钝化:RSI持续在70以上(比如连续3天以上在80以上) -
低位钝化:RSI持续在30以下(比如连续3天以上在20以下)
钝化意味着什么?
传统理论认为RSI超买就该卖,超卖就该买。但在强趋势行情中,RSI可能长时间钝化:
-
牛市中:RSI可能长期在70-80甚至更高,此时如果盲目做空会损失惨重 -
熊市中:RSI可能长期在20-30甚至更低,此时如果盲目做多也会被套
如何应对钝化?
def detect_rsi_bluntness(rsi_values: list, threshold: float,
                        min_periods: int = 3) -> dict:
    """
    检测RSI钝化

    Args:
        rsi_values: RSI序列
        threshold: 阈值(80表示高位钝化,20表示低位钝化)
        min_periods: 最少持续周期

    Returns:
        钝化信息
    """
    result = {
        'is_blunt': False,
        'periods': 0,
        'description': ''
    }

    if len(rsi_values) < min_periods:
        return result

    # 统计连续满足条件的周期数
    consecutive_count = 0
    for rsi in reversed(rsi_values):
        if threshold > 50:  # 高位钝化
            if rsi >= threshold:
                consecutive_count += 1
            else:
                break
        else:  # 低位钝化
            if rsi <= threshold:
                consecutive_count += 1
            else:
                break

    if consecutive_count >= min_periods:
        result['is_blunt'] = True
        result['periods'] = consecutive_count

        if threshold > 50:
            result['description'] = (
                f"RSI高位钝化({consecutive_count}周期) - 强势行情持续,"
                f"特殊行情: 强趋势行情,可持有但严控风险"
            )
        else:
            result['description'] = (
                f"RSI低位钝化({consecutive_count}周期) - 弱势行情持续,"
                f"特殊行情: 弱趋势行情,暂不抄底"
            )

    return result


# 示例:高位钝化
rsi_values = [70, 75, 78, 82, 85, 83, 84, 86, 88]
bluntness = detect_rsi_bluntness(rsi_values, threshold=80, min_periods=3)
if bluntness['is_blunt']:
    print(bluntness['description'])
    # 输出: RSI高位钝化(6周期) - 强势行情持续,特殊行情: 强趋势行情,可持有但严控风险
在智能解读中的应用
在RsiItem的get_info_text方法中,我们已经实现了钝化检测:
def get_info_text(self, ix: int) -> str:
    """获取RSI信息文本"""
    # ... 其他分析 ...

    # RSI钝化分析
    if rsi_value > 80:
        consecutive_count = 1
        check_ix = ix - 1
        while check_ix >= 0and check_ix in self.rsi_data and self.rsi_data[check_ix] > 80:
            consecutive_count += 1
            check_ix -= 1

        if consecutive_count >= 3:
            words.append(f"RSI高位钝化({consecutive_count}周期) - 强势行情持续")
            words.append("特殊行情: 强趋势行情,可持有但严控风险")

    elif rsi_value < 20:
        consecutive_count = 1
        check_ix = ix - 1
        while check_ix >= 0and check_ix in self.rsi_data and self.rsi_data[check_ix] < 20:
            consecutive_count += 1
            check_ix -= 1

        if consecutive_count >= 3:
            words.append(f"RSI低位钝化({consecutive_count}周期) - 弱势行情持续")
            words.append("特殊行情: 弱趋势行情,暂不抄底")

    return"\n".join(words)
实战建议:
-
钝化时不要逆势操作 -
高位钝化可以持有多单,但要严格止损 -
低位钝化不要急于抄底,等待反转确认 -
结合均线、成交量等指标判断趋势强度
四、RSI参数优化:不同市场的最佳设置
RSI的默认参数是14周期,超买线70,超卖线30。但这些参数不是万能的,需要根据不同市场和品种进行优化。
4.1 周期参数优化
标准周期:14
-
适用于大多数市场 -
平衡灵敏度和稳定性 -
推荐新手使用
短周期:5-9
-
更敏感,信号更早 -
但假信号也更多 -
适合短线交易、日内交易
长周期:21-28
-
更稳定,假信号少 -
但信号滞后 -
适合中长线交易
让我们写一个参数优化的函数:
def optimize_rsi_period(prices: list, min_period: int = 5,
                       max_period: int = 30) -> dict:
    """
    优化RSI周期参数
    通过回测找到最佳周期

    Args:
        prices: 价格序列
        min_period: 最小周期
        max_period: 最大周期

    Returns:
        优化结果
    """
    best_period = 14
    best_score = 0

    results = {}

    for period in range(min_period, max_period + 1):
        # 计算RSI
        rsi_array = talib.RSI(np.array(prices), timeperiod=period)

        # 简单的回测策略:超卖买入,超买卖出
        signals = []
        positions = []
        current_position = 0

        for i in range(period, len(rsi_array)):
            if np.isnan(rsi_array[i]):
                continue

            signal = 0
            if rsi_array[i] < 30and current_position == 0:
                signal = 1# 买入信号
                current_position = 1
            elif rsi_array[i] > 70and current_position == 1:
                signal = -1# 卖出信号
                current_position = 0

            signals.append(signal)
            positions.append(current_position)

        # 计算收益(简化版)
        returns = 0
        buy_price = 0
        for i, signal in enumerate(signals):
            if signal == 1:
                buy_price = prices[period + i]
            elif signal == -1and buy_price > 0:
                returns += (prices[period + i] - buy_price) / buy_price
                buy_price = 0

        results[period] = returns

        if returns > best_score:
            best_score = returns
            best_period = period

    return {
        'best_period': best_period,
        'best_score': best_score,
        'all_results': results
    }


# 示例使用
prices = [100 + i + (i % 5) * 2for i in range(100)]  # 模拟价格数据
optimization = optimize_rsi_period(prices)
print(f"最佳周期: {optimization['best_period']}")
print(f"最佳收益率: {optimization['best_score']:.2%}")
4.2 超买超卖阈值优化
不同的市场特性需要不同的阈值:
|
|
|
|
|
|---|---|---|---|
|
|
|
|
|
|
|
|
|
|
|
|
|
|
|
|
|
|
|
|
|
|
|
|
|
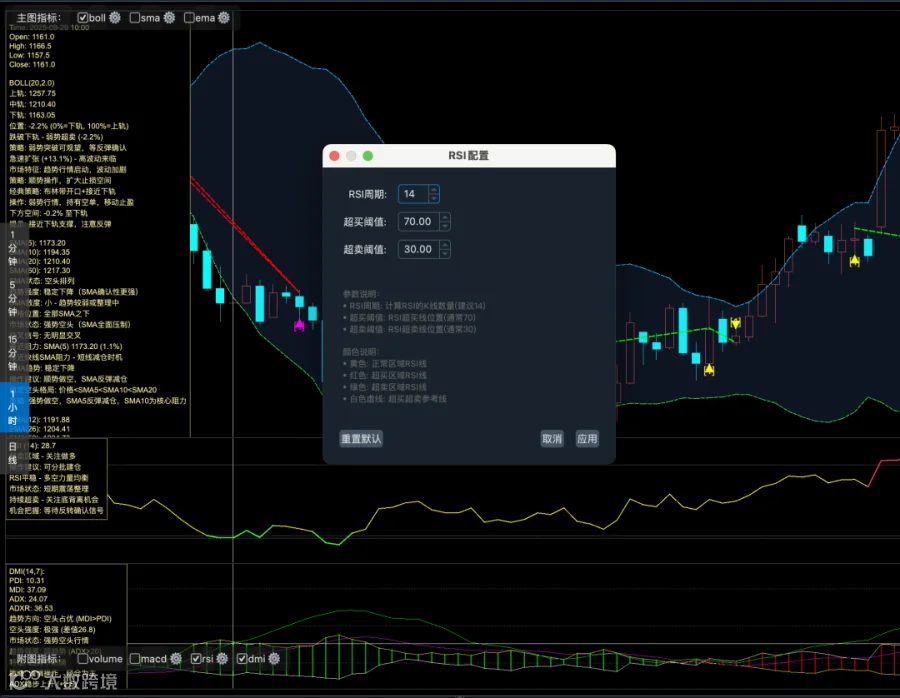
在ATMQuant中,我们允许用户自定义这些参数:
# core/charts/rsi_item.py

class RsiItem(ChartItem, ConfigurableIndicator):
    """RSI指标,支持参数配置"""

    def get_config_dialog(self, parent: QtWidgets.QWidget) -> QtWidgets.QDialog:
        """获取配置对话框"""
        config_items = [
            ("rsi_window", "RSI周期", "spinbox",
             {"min": 5, "max": 100, "value": self.rsi_window}),
            ("rsi_long_threshold", "超买阈值", "doublespinbox",
             {"min": 60.0, "max": 90.0, "step": 1.0, "value": self.rsi_long_threshold}),
            ("rsi_short_threshold", "超卖阈值", "doublespinbox",
             {"min": 10.0, "max": 40.0, "step": 1.0, "value": self.rsi_short_threshold})
        ]
        return self.create_config_dialog(parent, "RSI配置", config_items)

    def apply_config(self, config: Dict[str, Any]) -> None:
        """应用配置"""
        self.rsi_window = config.get('rsi_window', self.rsi_window)
        self.rsi_long_threshold = config.get('rsi_long_threshold', self.rsi_long_threshold)
        self.rsi_short_threshold = config.get('rsi_short_threshold', self.rsi_short_threshold)

        # 清空缓存,重新计算
        self.rsi_data.clear()
        self.update()
使用方法:
-
在图表上右键点击RSI指标 -
选择"配置" -
调整参数 -
点击"应用"即可看到效果
五、RSI实战策略:从单一指标到组合使用
理论和代码都讲完了,现在让我们看看在实战中如何使用RSI。
5.1 策略1:RSI超买超卖策略(简单但有效)
这是最基础的RSI策略:
策略逻辑:
-
当RSI < 30时,买入开多 -
当RSI > 70时,卖出平多 -
设置止损:亏损超过2%平仓
from vnpy.app.cta_strategy import CtaTemplate
from core.strategies.base_strategy import BaseCtaStrategy

class RsiOverboughtOversoldStrategy(BaseCtaStrategy):
    """RSI超买超卖策略"""

    # 策略参数
    rsi_window = 14
    rsi_entry = 30# 超卖入场
    rsi_exit = 70   # 超买出场
    stop_loss_percent = 0.02# 止损2%

    # 策略变量
    rsi_value = 0
    entry_price = 0

    parameters = ["rsi_window", "rsi_entry", "rsi_exit", "stop_loss_percent"]
    variables = ["rsi_value", "entry_price"]

    def __init__(self, cta_engine, strategy_name, vt_symbol, setting):
        super().__init__(cta_engine, strategy_name, vt_symbol, setting)

        # 初始化RSI数组管理器
        self.am = None

    def on_init(self):
        """策略初始化"""
        self.logger.info("策略初始化")
        self.load_bar(10)  # 加载10天历史数据

    def on_start(self):
        """策略启动"""
        self.logger.info("策略启动")

    def on_stop(self):
        """策略停止"""
        self.logger.info("策略停止")

    def on_bar(self, bar):
        """K线数据更新"""
        # 更新数组管理器
        self.am.update_bar(bar)
        ifnot self.am.inited:
            return

        # 计算RSI
        self.rsi_value = self.am.rsi(self.rsi_window)

        # 如果没有持仓
        if self.pos == 0:
            # 超卖,买入
            if self.rsi_value < self.rsi_entry:
                self.buy(bar.close_price + 5, 1)
                self.entry_price = bar.close_price
                self.logger.info(f"RSI超卖({self.rsi_value:.1f}) - 买入开多")

        # 如果持有多单
        elif self.pos > 0:
            # 超买,卖出
            if self.rsi_value > self.rsi_exit:
                self.sell(bar.close_price - 5, abs(self.pos))
                profit = (bar.close_price - self.entry_price) / self.entry_price
                self.logger.info(f"RSI超买({self.rsi_value:.1f}) - 卖出平多,收益率: {profit:.2%}")

            # 止损
            elif bar.close_price < self.entry_price * (1 - self.stop_loss_percent):
                self.sell(bar.close_price - 5, abs(self.pos))
                self.logger.warning(f"触发止损 - 卖出平多")
策略优点:
-
逻辑简单,容易理解 -
在震荡市场中表现良好
策略缺点:
-
在趋势市场中容易被打止损 -
容易遇到RSI钝化 -
盈亏比不理想
5.2 策略2:RSI + 均线组合策略(更可靠)
单一指标容易产生假信号,我们可以结合均线来过滤:
策略逻辑:
-
RSI < 30 且 价格在均线上方 → 买入(确认上升趋势中的回调) -
RSI > 70 且 价格在均线下方 → 卖出(确认下降趋势中的反弹)
class RsiMaComboStrategy(BaseCtaStrategy):
    """RSI + 均线组合策略"""

    # 策略参数
    rsi_window = 14
    rsi_entry = 30
    rsi_exit = 70
    ma_window = 20# 均线周期
    stop_loss_percent = 0.02

    # 策略变量
    rsi_value = 0
    ma_value = 0
    entry_price = 0

    parameters = ["rsi_window", "rsi_entry", "rsi_exit", "ma_window", "stop_loss_percent"]
    variables = ["rsi_value", "ma_value", "entry_price"]

    def on_bar(self, bar):
        """K线数据更新"""
        self.am.update_bar(bar)
        ifnot self.am.inited:
            return

        # 计算指标
        self.rsi_value = self.am.rsi(self.rsi_window)
        self.ma_value = self.am.sma(self.ma_window)

        # 如果没有持仓
        if self.pos == 0:
            # RSI超卖 且 价格在均线上方(上升趋势中的回调)
            if self.rsi_value < self.rsi_entry and bar.close_price > self.ma_value:
                self.buy(bar.close_price + 5, 1)
                self.entry_price = bar.close_price
                self.logger.info(
                    f"RSI超卖({self.rsi_value:.1f}) + 价格在均线上方 - 买入开多"
                )

        # 如果持有多单
        elif self.pos > 0:
            # RSI超买 或 价格跌破均线
            if self.rsi_value > self.rsi_exit or bar.close_price < self.ma_value:
                self.sell(bar.close_price - 5, abs(self.pos))
                profit = (bar.close_price - self.entry_price) / self.entry_price

                exit_reason = "RSI超买"if self.rsi_value > self.rsi_exit else"跌破均线"
                self.logger.info(f"{exit_reason} - 卖出平多,收益率: {profit:.2%}")

            # 止损
            elif bar.close_price < self.entry_price * (1 - self.stop_loss_percent):
                self.sell(bar.close_price - 5, abs(self.pos))
                self.logger.warning(f"触发止损 - 卖出平多")
策略优点:
-
用均线确认趋势,减少假信号 -
在趋势市场中表现更好 -
盈亏比有所改善
策略缺点:
-
信号数量减少 -
可能错过一些机会
5.3 策略3:RSI背离策略(高级)
利用RSI背离捕捉趋势反转:
策略逻辑:
-
检测到底背离 → 等待RSI回到50上方确认 → 买入 -
检测到顶背离 → 等待RSI跌破50确认 → 卖出
class RsiDivergenceStrategy(BaseCtaStrategy):
    """RSI背离策略"""

    # 策略参数
    rsi_window = 14
    divergence_lookback = 10# 背离检测回看周期
    confirm_threshold = 50# 确认阈值

    # 策略变量
    rsi_value = 0
    has_bull_divergence = False
    has_bear_divergence = False
    entry_price = 0

    parameters = ["rsi_window", "divergence_lookback", "confirm_threshold"]
    variables = ["rsi_value", "has_bull_divergence", "has_bear_divergence"]

    def on_bar(self, bar):
        """K线数据更新"""
        self.am.update_bar(bar)
        ifnot self.am.inited:
            return

        # 计算RSI
        self.rsi_value = self.am.rsi(self.rsi_window)

        # 检测背离
        divergence = self.detect_divergence()

        # 没有持仓
        if self.pos == 0:
            # 检测到底背离
            if divergence['bull_divergence']:
                self.has_bull_divergence = True
                self.logger.info("检测到底背离 - 等待确认")

            # 底背离确认(RSI回到50上方)
            if self.has_bull_divergence and self.rsi_value > self.confirm_threshold:
                self.buy(bar.close_price + 5, 1)
                self.entry_price = bar.close_price
                self.has_bull_divergence = False
                self.logger.info(f"底背离确认 - 买入开多")

        # 持有多单
        elif self.pos > 0:
            # 检测到顶背离
            if divergence['bear_divergence']:
                self.has_bear_divergence = True
                self.logger.info("检测到顶背离 - 等待确认")

            # 顶背离确认(RSI跌破50)
            if self.has_bear_divergence and self.rsi_value < self.confirm_threshold:
                self.sell(bar.close_price - 5, abs(self.pos))
                profit = (bar.close_price - self.entry_price) / self.entry_price
                self.has_bear_divergence = False
                self.logger.info(f"顶背离确认 - 卖出平多,收益率: {profit:.2%}")

    def detect_divergence(self) -> dict:
        """检测RSI背离"""
        result = {
            'bull_divergence': False,
            'bear_divergence': False
        }

        if len(self.am.close_array) < self.divergence_lookback * 2:
            return result

        # 获取数据
        prices = self.am.close_array[-self.divergence_lookback*2:]
        rsi_values = [self.am.rsi(self.rsi_window, array=True)[i]
                     for i in range(-self.divergence_lookback*2, 0)]

        recent_prices = prices[-self.divergence_lookback:]
        recent_rsi = rsi_values[-self.divergence_lookback:]
        history_prices = prices[:self.divergence_lookback]
        history_rsi = rsi_values[:self.divergence_lookback]

        # 顶背离
        if max(recent_prices) > max(history_prices) and max(recent_rsi) < max(history_rsi):
            result['bear_divergence'] = True

        # 底背离
        if min(recent_prices) < min(history_prices) and min(recent_rsi) > min(history_rsi):
            result['bull_divergence'] = True

        return result
策略优点:
-
可以捕捉到大的趋势反转 -
胜率较高 -
盈亏比优秀
策略缺点:
-
信号较少 -
需要等待确认,可能错过最佳入场点 -
假背离也存在
六、写在最后
RSI是最经典的技术指标之一,从原理到实战,我们完整地讲解了它的方方面面。
通过这篇文章,你应该已经掌握了RSI的计算原理、经典用法(超买超卖、背离、钝化)、参数优化方法,以及多个实战策略。
但记住这几点:
-
不要单独使用RSI,一定要结合其他指标 -
警惕钝化,强趋势中RSI可能失效 -
背离需要确认,耐心等待价格确认信号 -
止损永远第一,保护本金最重要
下一篇,我们将深入研究布林带(Bollinger Bands) —— 波动率交易的完整指南。
Stay tuned!
本文是《量化指标解码》系列文章的第2篇,完整代码已开源至GitHub:https://github.com/seasonstar/atmquant
本文内容仅供学习交流,不构成任何投资建议。交易有风险,投资需谨慎。
📌 相关标签
加入「量策堂·AI算法指标策略」
想系统性掌握策略研发、指标可视化与回测优化?加入我的知识星球,获得持续、体系化的成长支持:

往期文章回顾
《量化指标解码》系列
《以AI量化为生》系列(交易系统开发)
-
以AI量化为生:15.双图与四图视图开发实战 -
以AI量化为生:14.多周期交易买卖点连线智能匹配实战 -
以AI量化为生:13.交易时段小时K线合成实战 -
以AI量化为生:12.多周期图表开发实战 -
以AI量化为生:11.增强版K线图表系统开发实战 -
以AI量化为生:10.回测界面大改版与用户体验全面提升