

课程安排
| 9月27日-28日 | 破“卷”立新-国自然/省级基金项目撰写技巧全流程实战 |
| 9月25日-26日 | AI赋能·SCI论文从实验设计到发表全流程实践训练营 |
| 10月24日-25日、 31日-11月1日 |
|
|
9月19日-20日、 |
|
|
9月19日-20日、 |
智能遥感新质生产力暨DeepSeek、Python、OpenCV驱动的空天地数据识别与计算及15个行业标杆案例实践培训班 |
|
10月17日-18日、 |
全链路自主构建智慧科研写作系统——融合LLM语义理解、多智能体任务协同与n8n自动化工作流构建培训班 |
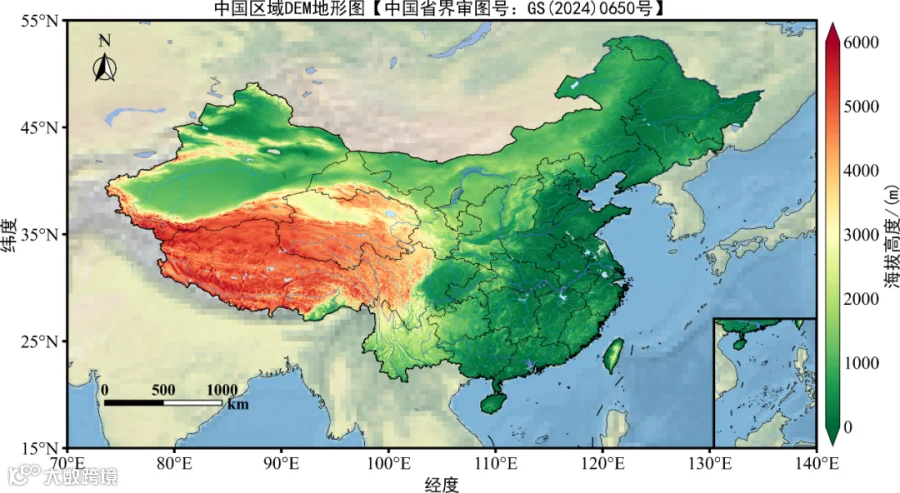
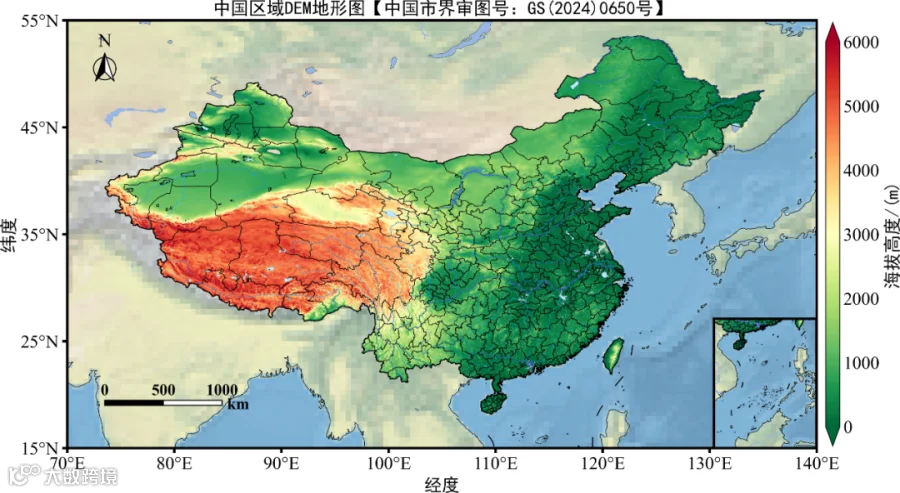
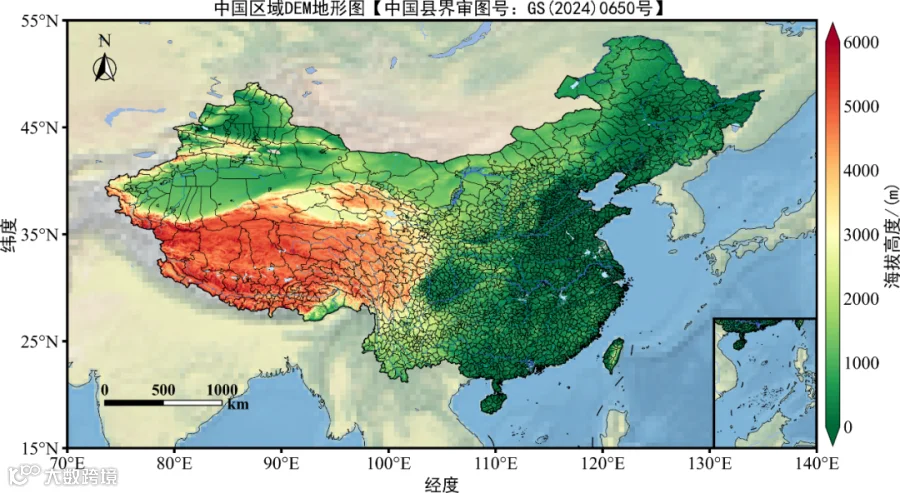
中国地图使用规范与科研绘图示例
在科研论文中正确使用带审图号的中国地图,需严格遵循以下四条规范:
1. 获取标准地图
应使用自然资源部标准地图服务系统(http://bzdt.ch.mnr.gov.cn/)提供的标准地图,确保地图已通过审核并带有审图号。
2. 不得随意修改地图内容
多数期刊要求所用底图边界不得修改,包括南海诸岛位置等。如《地理学报》《地理科学》等明确指出,非标准底图不予发表;若使用标准地图,不得对底图进行任何改动。
3. 标注审图号
在图题下方或其他显著位置注明审图号,例如:“注:该图基于自然资源部标准地图服务网站下载的审图号为GS(20××)××××号的标准地图制作,底图边界无修改”,或根据地方标准地图来源相应标注。
4. 遵循地图内容表示规范
依据《公开地图内容表示规范》,准确表达中国全图、南海诸岛、钓鱼岛及其附属岛屿、台湾省、特别行政区等区域,确保国家领土完整不受影响,不压盖国界线或重要岛屿等涉及主权的内容。
Python绘制中国区域DEM地形图示例
import numpy as np
import matplotlib.pyplot as plt
from matplotlib.colors import LinearSegmentedColormap
import xarray as xr
from cartopy.mpl.ticker import LongitudeFormatter, LatitudeFormatter
import cartopy.crs as ccrs
import cartopy.feature as cfeature
from cartopy.io.shapereader import Reader
import pandas as pd
import rioxarray as rxr
import geopandas as gpd
import rasterio
import cmaps
from matplotlib import rcParams
config = {"font.family":'Times New Roman',"font.size":18,"mathtext.fontset":'stix'}
rcParams.update(config)

# 读取GMTED2010地形数据
shapefile = r"./China_20240650_2.shp"
raster_path = r"./GMTED2010_China.tif"
boundary = gpd.read_file(shapefile).to_crs("EPSG:4326")
with rasterio.open(raster_path) as src:
    out_image, out_transform = rasterio.mask.mask(src, boundary.geometry, crop=True)
    data = out_image[0]
    nodata = src.nodata
data = np.ma.masked_invalid(data)
if nodata is not None:
    data = np.ma.masked_equal(data, nodata)
data = np.ma.masked_less_equal(data, 0)
nrows, ncols = data.shape
x = np.arange(ncols) * out_transform[0] + out_transform[2]
y = np.arange(nrows) * out_transform[4] + out_transform[5]
X, Y = np.meshgrid(x, y)

# 绘制中国区域地形图
region=[70, 140, 15, 55]
proj=ccrs.PlateCarree()
fig=plt.figure(figsize=(16,9),dpi=600)
ax = plt.axes(projection=proj)
ax.set_extent(region, crs=proj)
ax.stock_img()
ax.add_feature(cfeature.COASTLINE.with_scale('50m'),linewidth=0.5,zorder=0.5,color='k')
ax.add_feature(cfeature.OCEAN.with_scale('50m'))
ax.add_feature(cfeature.LAND.with_scale('50m'))
ax.add_feature(cfeature.LAKES.with_scale('50m'))

tick=np.arange(0,6000.1,1000)
cs=ax.pcolormesh(X[::4,::4],Y[::4,::4],data[::4,::4],transform=ccrs.PlateCarree(),cmap="MPL_RdYlGn_r",vmin=0,vmax=6000)

gdf=gpd.read_file('./China_20240650.shp',encoding='utf-8')
import cartopy.mpl.patch as cmp
paths=cmp.geos_to_path(list(gdf['geometry']))
import matplotlib.path as mpath
clip_path=mpath.Path.make_compound_path(*paths)
cs.set_clip_path(clip_path,transform=ax.transData)

cbar=plt.colorbar(cs,ticks=tick,shrink=0.85,orientation='vertical',extend='both',pad=0.01,aspect=30)
cbar.ax.tick_params(labelsize=18,direction='in',right=False)
font3={'family':'SimHei','size':18,'color':'k'}
cbar.set_label('海拔高度/(m)',fontdict=font3)

ax.set_xticks(np.arange(region[0], region[1] + 1, 10), crs=proj)
ax.set_yticks(np.arange(region[-2], region[-1] + 1, 10), crs=proj)
ax.xaxis.set_major_formatter(LongitudeFormatter(zero_direction_label=False))
ax.yaxis.set_major_formatter(LatitudeFormatter())

ax.add_geometries(Reader(r'./China_20240650_2.shp').geometries(),ccrs.PlateCarree(),facecolor='none',edgecolor='k',linewidth=1)
ax.add_geometries(Reader(r'./China_Province_20240650.shp').geometries(),ccrs.PlateCarree(),facecolor='none',edgecolor='k',linewidth=0.5)
ax.add_geometries(Reader(r'./China_10line_20240650.shp').geometries(),ccrs.PlateCarree(),facecolor='none',edgecolor='k',linewidth=1)
ax.add_geometries(Reader(r'./ne_50m_lakes.shp').geometries(),ccrs.PlateCarree(),facecolor='none',edgecolor='k',linewidth=0.2)
ax.add_geometries(Reader(r'./1级河流.shp').geometries(),ccrs.PlateCarree(),facecolor='none',edgecolor='RoyalBlue',linewidth=0.4)
ax.add_geometries(Reader(r'./2级河流.shp').geometries(),ccrs.PlateCarree(),facecolor='none',edgecolor='DodgerBlue',linewidth=0.3)
ax.add_geometries(Reader(r'./3级河流.shp').geometries(),ccrs.PlateCarree(),facecolor='none',edgecolor='DeepSkyBlue',linewidth=0.2)
ax.add_geometries(Reader(r'./4级河流.shp').geometries(),ccrs.PlateCarree(),facecolor='none',edgecolor='SkyBlue',linewidth=0.15)
ax.add_geometries(Reader(r'./5级河流.shp').geometries(),ccrs.PlateCarree(),facecolor='none',edgecolor='LightSkyBlue',linewidth=0.05)
ax.add_geometries(Reader(r'./主要湖泊.shp').geometries(),ccrs.PlateCarree(),edgecolor='none',linewidth=0,facecolor='#BEE8FF')

ax.set_title('中国区域DEM地形图【中国省界审图号:GS(2024)0650号】',fontdict=font3)
plt.ylabel("纬度",fontdict=font3)
plt.xlabel("经度",fontdict=font3)

# 绘制南海小地图
ax2 = fig.add_axes([0.6313, 0.1645, 0.2, 0.2],projection=proj)
leftlon, rightlon, lowerlat, upperlat = (105,124,0,24)
extend_southsea=[leftlon, rightlon, lowerlat, upperlat]
ax2.set_extent(extend_southsea, crs=ccrs.PlateCarree())
ax2.stock_img()
ax2.add_feature(cfeature.COASTLINE.with_scale('50m'),linewidth=0.5,zorder=0.5,color='k')
ax2.add_feature(cfeature.LAKES.with_scale('50m'))
ax2.add_feature(cfeature.RIVERS.with_scale('50m'))
ax2.add_feature(cfeature.OCEAN.with_scale('50m'))
ax2.add_feature(cfeature.LAND.with_scale('50m'))
ax2.add_geometries(Reader(r'./China_20240650_2.shp').geometries(),ccrs.PlateCarree(),facecolor='none',edgecolor='k',linewidth=1)
ax2.add_geometries(Reader(r'./China_Province_20240650.shp').geometries(),ccrs.PlateCarree(),facecolor='none',edgecolor='k',linewidth=0.5)
ax2.add_geometries(Reader(r'./China_10line_20240650.shp').geometries(),ccrs.PlateCarree(),facecolor='none',edgecolor='k',linewidth=1)
ax2.add_geometries(Reader(r'./ne_50m_lakes.shp').geometries(),ccrs.PlateCarree(),facecolor='none',edgecolor='k',linewidth=0.2)
ax2.add_geometries(Reader(r'./1级河流.shp').geometries(),ccrs.PlateCarree(),facecolor='none',edgecolor='RoyalBlue',linewidth=0.4)
ax2.add_geometries(Reader(r'./2级河流.shp').geometries(),ccrs.PlateCarree(),facecolor='none',edgecolor='DodgerBlue',linewidth=0.3)
ax2.add_geometries(Reader(r'./3级河流.shp').geometries(),ccrs.PlateCarree(),facecolor='none',edgecolor='DeepSkyBlue',linewidth=0.2)
ax2.add_geometries(Reader(r'./4级河流.shp').geometries(),ccrs.PlateCarree(),facecolor='none',edgecolor='SkyBlue',linewidth=0.15)
ax2.add_geometries(Reader(r'./5级河流.shp').geometries(),ccrs.PlateCarree(),facecolor='none',edgecolor='LightSkyBlue',linewidth=0.05)
ax2.add_geometries(Reader(r'./主要湖泊.shp').geometries(),ccrs.PlateCarree(),edgecolor='none',linewidth=0,facecolor='#BEE8FF')
css=ax2.pcolormesh(X[::4,::4],Y[::4,::4],data[::4,::4],transform=ccrs.PlateCarree(),cmap="MPL_RdYlGn_r",vmin=0,vmax=6000)

gdf2=gpd.read_file('./China2_nanhai_2.shp',encoding='utf-8')
paths2=cmp.geos_to_path(list(gdf2['geometry']))
clip_path2=mpath.Path.make_compound_path(*paths2)
css.set_clip_path(clip_path2,transform=ax2.transData)

plt.savefig('./plot494.6.png',dpi=400,bbox_inches='tight',pad_inches=0)
plt.show()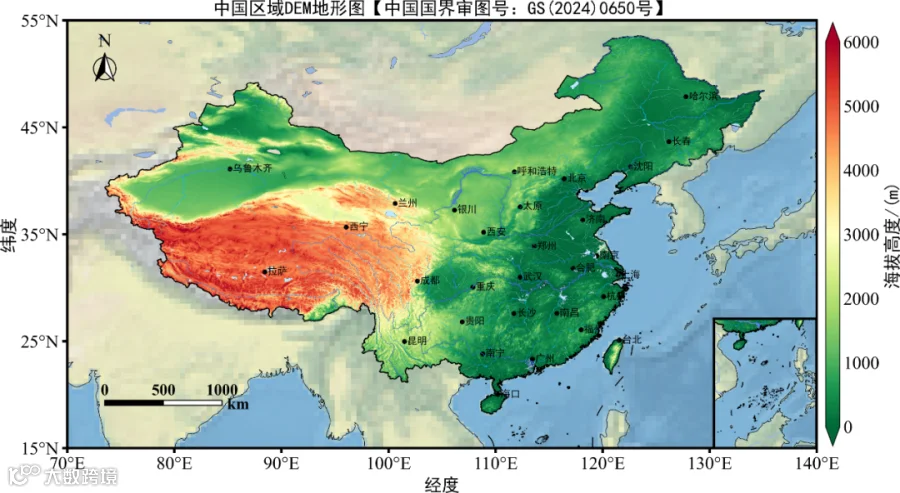
AI多领域融合课程、论文写作、科研绘图、语言类培训
| AI多领域融合课程、论文写作、科研绘图、语言类 | |
| 10月24日-25日、 31日-11月1日 |
|
| 9月25日-26日 | AI赋能·SCI论文从实验设计到发表全流程实践训练营 |
| 9月20日-21日、 27日-28日 |
GeoAI大模型驱动的地球科学智能计算前沿实践研修班 |
| 9月27日-28日 | 破“卷”立新-国自然/省级基金项目撰写技巧全流程实战 |
| 10月17日-18日、 24日-25日 |
全链路自主构建智慧科研写作系统——融合LLM语义理解、多智能体任务协同与n8n自动化工作流构建培训班 |
| 9月19日-20日、 26日-27日 |
智能遥感新质生产力暨DeepSeek、Python、OpenCV驱动的空天地数据识别与计算及15个行业标杆案例实践培训班 |
| 9月19日-20日、 26日-27日 |
一图胜千言-顶刊级科研绘图工坊暨AI支持下Nature级数据可视化高级培训班 |
| 10月10日-13日 | 2025最新AI-Python机器学习与深度学习实践技术应用培训班 |
| 10月15日-16日、 22日-23日 |
|
| 10月17日-18日、 24日-25日 |
AI智慧高光谱遥感实战精修班暨手撕99个案例项目、全覆盖技术链与应用场景一站式提升方案 |
农林生态、遥感、大气科学培训
| 农林生态、遥感、大气科学 | |
| 9月20日-21日、 28日 |
2025最新AI+CMIP6数据分析与可视化、降尺度技术与气候变化的区域影响、极端气候分析高级培训班 |
| 9月20日-21日、 26日-28日 |
AI赋能Python-GEE遥感云大数据分析、可视化与Satellite Embedding创新应用高级培训班 |
| 10月18日-19日、 25日-26日 |
2025年最新AI与Python在地球科学多源数据交叉融合中的前沿技术应用高级培训班 |
| 10月18日-19日、 25日-26日 |
AI+Python驱动的无人机生态三维建模与碳储/生物量/LULC估算全流程实战技术培训班 |
| 10月24日-27日 | 最新HYDRUS全模块进阶应用:土壤–水–污染物耦合模拟案例精讲培训班 |
| 10月18日-19日、 24日-26日 |
双碳目标下基于“遥感+”集成技术的碳储量、碳排放、碳循环、温室气体等多领域监测与模拟实践高级培训班 |
水文水资源、地质、遥感、测量培训
| 水文水资源、地质、遥感、测量 | |
| 9月13日-15日、 19日-21日 |
地表水-地下水耦合建模全景解析暨SWAT-MODFLOW地表与地下协同模拟及多情景专题应用培训班 |
| 10月18日-19日、 25日-26日 |
全流程GMS地下水数值模拟及溶质(包含反应性溶质)运移模拟技术深度应用 |
声明:本号旨在传播、传递、交流,对相关文章内容观点保持中立态度。涉及内容如有侵权或其他问题,请与本号联系,第一时间做出撤回。