


Research on the size effect of specific cutting energy based on numerical simulation of single grit scratching
Tao Zhang1,3, Feng Jiang1,3*, Lan Yan2,3, Xipeng Xu1,3
1Institute of Manufacturing Engineering, Huaqiao University, 361021 Xiamen, P R China
2College of Mechanical Engineering and Automation, Huaqiao University, 361021 Xiamen, P R China
3 Engineering Research Center for Brittle Material Intelligent Manufacturing Technology of Fujian Province,
361021 Xiamen, P R China
*Corresponding author Tel: 86-18106953128, Fax: 86-592-6162616, E-mail: jiangfeng@hqu.edu.cn
Abstract
A method of research on the size effect of the specific cutting energy based on the numerical simulation has been proposed. The theoretical model of the research on size effect of specific cutting energy using single grit scratching simulation has been presented. A series of single grit scratch simulations with different scratching depths have been carried out to acquire different material removal rates. Then, the specific cutting energy has been calculated based on the power consumed and the material removal rate. The relationship between the specific cutting energy and the material removal rate has been given which agrees well with that presented by Malkin. The simulation results have been analyzed further to explain the size effect of specific cutting energy.
Key words: Size effect; Specific cutting energy; Single grit scratching; Numerical simulation
0. Introduction
The specific grinding energy is defined as the energy consumed per unit volume of material removal during grinding process. The phenomenon that specific grinding energy decreases with the increase of grinding depth or sectional area of the chip is called size effect. The size effect of grinding was first presented by Shaw [1], then Malkin validated the existence of the size effect [2]. Malkin presented that total grinding energy consists of cutting and sliding energy [3]. Even after subtracting the sliding energy, the size effect still exists [4-6]. The phenomenon that specific cutting energy increases with the decrease of material removal rate is called size effect of specific cutting energy.
The size effect during grinding process is composed of the size effect of the sliding energy and cutting energy. The sliding energy is caused by the wear flat on the tip of grit according to the description of Malkin, and the wear flat is difficult to avoid for high speed scratching. Therefore, the study of size effect of specific cutting energy is extremely difficult due to the companion of sliding energy. Most of the studies focused on the size effect as a whole [7]. There are several different explanations of the size effect. Shaw presented that the existence of size effect results from the metal internal defects [1]. Because the probability is small that small-volume metal contains dislocation, so the small non-deformed chip thickness corresponds to a higher flow stress. But it was found that the density of dislocation is large in the shear zone in metal cutting experiments [8]. It is obvious that this theory is not a good explanation for size effect. Pashley gave an explanation of size effect from the view of work hardening [9]. Rowe explained the size effect by the presentation of “sliced bread analogy” [10]. Size effect is a very complex phenomenon, previous research showed that specific energy during grinding process is related not only to grinding process parameters, but also to the mechanical properties of the workpiece material [11]. It is extremely different to study size effect of specific cutting energy by experiment due to the exist of wear flat in reality, and few literatures focused on the size effect of specific cutting energy during grinding process due to the extremely low realizability.
Grinding is a very complex process. It is a common method to abstract the complicated scientific problems to simple problems by academic analysis and experimental research. Therefore, the study of the grit-workpiece interaction through single grit scratching test is an important contribution to the explanation of the physical processes that occur during grinding. Single grit scratching test has been widely used to study the material removal mechanism [12, 13]. Numerical simulation could reveal the phenomena that are difficult to investigate or unclear in the material removal mechanism and has been widely used in single grit scratching process [14-16].
In this study, a method of research on the size effect of the specific cutting energy based on the numerical simulation has been proposed. The theoretical model of the research on size effect of specific cutting energy using single grit scratching simulation has been presented, and the specific cutting energy has been calculated based on the power consumed and the material removal rate. The relationship between the specific cutting energy and the material removal rate has been given. The conclusion has been got that the flow stress increases with the decrease of removal rate, which explains the relationship between specific cutting energy and material removal rate well. It is also found that the pile-up ratio decreases with the increase of scratching depth, which could explain the size effect of specific cutting energy from another perspective.
1. Theoretical model
The removal of the metallic material is achieved by the formation of chips in the grinding process. However, most of the grinding energy is not consumed by the formation of chips but by wear flat of grit slides on the surface of workpiece, but the sliding process cannot remove material. The working condition of a single grit in grinding process is shown in Fig.1. Malkin presented that the grinding forces and specific grinding energy consists of cutting and sliding. So the forces applied on the single grit and specific grinding energy can be expressed as [3]:
(1)
(2)
(3)
Where Fn and Ft are the tangential and normal force applied on the single grit, respectively. Ft,c and Fn,c are the tangential and normal force for cutting, and Ft,cl and Fn,cl are those for sliding. The u is specific grinding energy; uc and usl are specific cutting energy and specific sliding energy, respectively.
As shown in Fig. 1. There is a wear flat on the tip grit. For steel workpiece, the sliding forces are proportional to the area of the wear flat. So the forces applied on the single grit could also be expressed as [3]:
(4)
(5)
where p is the average contact stress between grit and workpiece, and μ is the coefficient of friction. Aa is the area of wear flat.
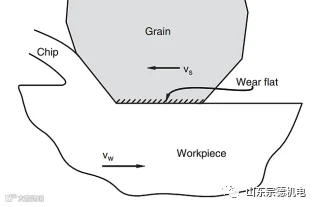
Fig.1 The working condition of a single grit [3]
In general, girt can be simplified as a cone with a spherical tip. When the tip of ideal grit is always no wear exists that is the area of wear flat is equal to zero, then the Ft,cl and Fn,cl and usl can be ignored, and the equations (1) , (2) and (3) can be simplified as following:
(6)
(7)
(8)
The research process of the relationship between the specific cutting energy and the material removal rate can be greatly simplified comparing to that provided by Malkin when the ideal grit which is never worn during scratching process is applied to single grit scratch test. But the most serious problem is that such an ideal grit does not exist. Numerical simulation provides a solution to the problem, in which the wear can be defined as non-existent.
2. Numerical simulation
2.1 The process of simulation
Single grit scratch simulation is performed with AdvantEdgeTM, which integrates advanced finite element models for single grit scratch. The procedure of numerical calculation is shown in Fig.2. Numerical simulation involves many models including material constitutive model, friction model and thermal property model. The precision of the numerical simulation depends on the model whose accuracy is the worst.
Fig.2 The procedure of numerical calculation
2.2 The physical model
The Fe-Cr-Ni stainless steel and cubic Boron Nitride (cBN) have been selected as the workpiece and grit material, respectively. Fe-Cr-Ni stainless steel is a commonly used material for steam turbine blades which is a kind of austenitic stainless steel. The steam turbine blades of Fe-Cr-Ni stainless steel usually formed using grinding process. The material model is the most important model in numerical simulation. Common material constitutive models include the Power Law (P-L), the Johnson-Cook mode (J-C), and the Wright-Batra [17]. The material models including material constitutive and thermal property model of cBN were offered by material library of AdvantEdgeTM. The P-L constitutive model for workpiece material is used in the simulation, which considers strain strengthening, strain rate strengthening, and thermal softening. The material constitutive model of Fe-Cr-Ni stainless steel based on P-L relationship could be expressed as:
(9)
Where σs is the flow stress, and σ0 is the yield stress at reference strain and temperature. T is the current deformation temperature. ε0 is the reference strain, ὲ0 is the reference strain rate. m is strain hardening exponent, n is the strain rate hardening exponent and c0~c5 are material constants of constitutive model. The material constitutive model of Fe-Cr-Ni stainless steel has been developed by high temperature Hopkinson pressure bar technology, which is expressed as the following [18]:
(10)
The proposed constitutive model has been incorporated in AdvantEdgeTM to model orthogonal metal cutting process. Orthogonal turning tests with the same parameters as the simulation have been carried out in CNC machine center. The comparison of test and simulation forces is shown in Fig.3. The average error of the tangential force and normal force were 15.26% and 4.45%, respectively, which proves that above material constitutive model has a high precision [18].
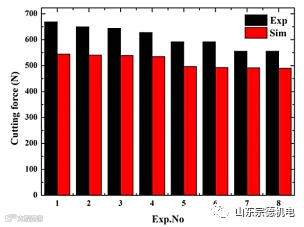
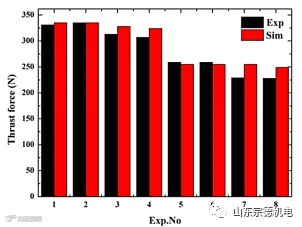
(a) Cutting force (b) Thrust force
Fig.3 Comparison of simulation and test results
Thermal properties of Fe-Cr-Ni stainless steel including thermal conductivity and heat capacity have been measured by a laser flash diffusivity apparatus, and the measurement results are shown in Fig.4 This material has a phase transition at 600~700℃. The transition could cause the change of thermal physical properties. Using polynomial fitting method, the relationship of specific heat capacity and temperature has been fitted at 20~600℃ and 600~1000℃, the result of the fitting are shown as following:
(11)
(12)
Using polynomial fitting method, the relationship of thermal conductivity and temperature has been fitted at 20~500℃ and 500~1000℃, the result of the fitting are shown as following:
(13)
(14)
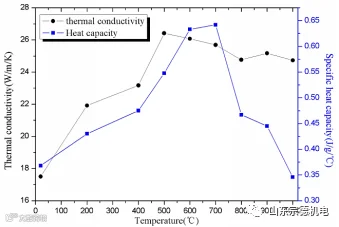
Fig.4 The thermal conductivity and heat capacity Fe-Cr-Ni stainless steel
The ball on disc tests have been carried out to determine the friction coefficient between grit and workpiece. The friction coefficient is defined as 0.25 according to the results, which has been inputted into AdvantEdge. The initial temperature is generally considered to be the room temperature, which was defned as 25℃ and inputted into AdvantEdgeTM.
2.3 The geometrical model
The geometrical model is shown in Fig.5. The CAD model of the single grit has been developed and inputted into AdvantEdgeTM which is a cone with the tip radius of 0.05mm. The upper part of the cone is a cylinder for restricting the position of single grit on the simulation process. The grid at the tip of the cone is meshed very small to ensure the precision of the simulation, and the grid away from the tip is relatively large to improve the simulation efficiency. The workpiece is a cuboid, and the CAD model can be defined directly in AdvantEdge by inputing the size parameters. The dimension of the workpiece is 1.2mm×0.8mm×0.5mm, as shown in Fig.5. The adaptive finite element mesh is the most important feature of the AdvantEdge. So the grid of the workpiece is not necessary to be meshed finely in the modeling process. The grid of workpiece closed to the grit is automatically refined appropriately and the grid away from the grit is refined slightly during the simulation. The simulation precision and efficiency could be guaranteed due to the feature of AdvantEdge. The single grit is fixed and the workpiece move relatively to the single grit with defined scratch depth. The related movement velocity and scratch depth could be inputted into AdvantEdge directly.
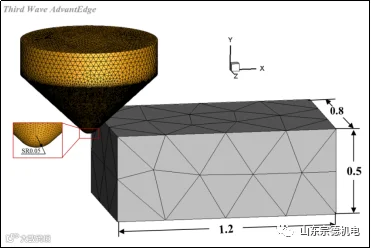
Fig.5 The geometrical model
3. Design of Simulation
In the study of the relationship of specific energy and removal rate, the grinding speed should remain the same in order to eliminate the effect of grinding speed on the specific energy. The material removal rate of grinding depends on the feed rate of workpiece and the grinding depth when the grinding speed is constant. For a single grit scratch test, different material removal rates could be got directly by changing the scratching depth when the scratching speed is constant. A series of simulations have been designed with different scratching depths to acquire different removal rates. The scratching speed was 30m/s for all group simulations. The design of simulation is shown in Tab.1.
Tab.1 The design of simulation
Simulation No. |
1 |
2 |
3 |
4 |
5 |
6 |
7 |
8 |
9 |
Scratch depth (μm) |
5 |
6 |
8 |
12 |
16 |
32 |
40 |
52 |
64 |
4. Results and discussions
The simulation results of single grit scratching are shown in Fig.6. The material temperature of the contact area between the single grit and the workpiece is close to the melting point of the workpiece material. The phenomenon also exists in all group simulations which are listed in Tab.1. The chip formation is extremely fast due to the high scratching speed. There is not enough time to pass the heat out, and single grit high speed scratching process can be considered an adiabatic process, which results in the temperature of the contact area is closed to the melting point. This viewpoint has been presented by Malkin [3]. Part of the material of workpiece flows toward the side of the grit to form the side flow and burr. At the same time, the segmental chip presented by Malkin is also found in the simulation results. The segmental chip acquired by simulation and that presented by Malkin are shown in Fig.7. Malkin has presented the reason for the formation of segmental chip that is the shear resistance of the material decreases due to localized heated caused by intense plastic deformation [3]. As shown in Fig.6 (a), the temperature between the two lamellas is higher than that of the other parts, which confirms the viewpoint presented by Malkin.
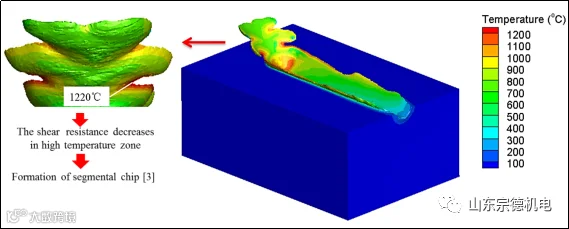
(a) Scratch morphology and temperature distribution (Scratching depth =40μm)
(a) Scratching depth =5μm |
(a) Scratching depth =6μm |
(a) Scratching depth =8μm |
(a) Scratching depth =12μm |
(a) Scratching depth =16μm |
(a) Scratching depth =32μm |
(a) Scratching depth =40μm |
(a) Scratching depth =52μm |
(a) Scratching depth =64μm |
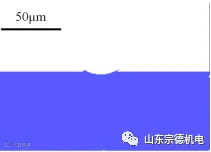
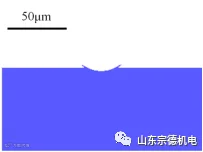
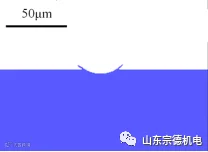
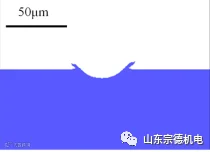
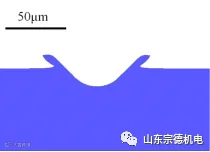
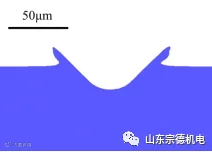
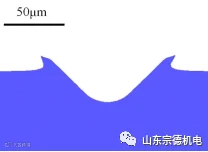
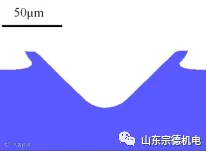
(b)Cross sections of scratches under different scratching depth
Fig.6 Simulation results of single grit scratching
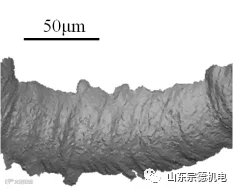
(a) The segmental chip acquired by simulation (scratching depth=5μm)
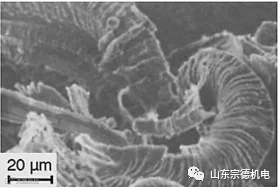
(b) The segmental chip presented by Malkin (SEM) [3]
Fig.7 the comparison of segmental chip
The material removal volume of unit length of scratch could be acquired by comparison the cross section of workpiece defined in section 2.3 before and after scratching, and the cross section of workpiece is shown in Fig.6 (b). The volume of material removed per unit time called removal rate could be calculated by combining the material removal volume of unit length of scratch and scratching speed. It is worth noting that the material removal rate is the actual material removal rate which considers that the side flow and burrs are not included in the material removal. Five material removal rates were calculated by intercepting five different cross sections for every scratch. The average of the five material removal rates is taken as the removal rate of the corresponding scratch process. AdvantEdgeTM can record the forces applied on grit and the power consumed by the scratching process timely as shown in Fig.8. The forces and power curves are smooth, which shows the stability of simulation. Then the specific cutting energy can be calculated by the following equation:
(15)
Where uc (J/mm3) is the specific cutting energy; P (W) is the power consumed of scratching process; Qw is the removal rate (mm3/s).
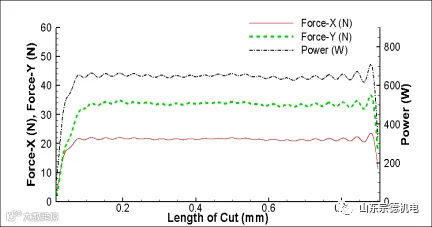
Fig.8 The forces and power consumed by the scratching process (Scratching depth =40μm)
The specific cutting energy under different material removal rates is shown in Fig.9. It is shown that the specific cutting energy increases drastically with the decrease of removal rate. Malkin has also presented the change trend of specific cutting energy with the variety of material removal rate as shown in Fig.10. The simulation results agree well with the Fig.10. It is worth noting that the simulation cannot be carried out when the cutting depth is extremely small due to the limitation of AdvantEdgeTM itself. The simulations just give the specific cutting energy when the material removal rate is large. However, the simulation results have shown the trend of specific cutting energy with the change of material removal rate clearly.
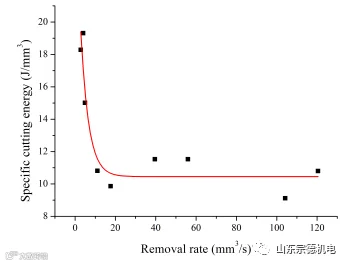
Fig.9 Specific cutting energy versus material removal rate
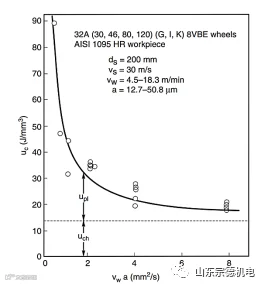
Fig.10 Specific cutting energy versus material removal rate presented by Malkin [3]
The strain rate, plastic strain and temperature of the workpiece material have been analyzed for several groups simulations with different scratching depths because of its representation. In order to acquire comprehensive results, scratches for different scratching depths are cut along the centerline. The results of strain rate, plastic strain and temperature of the workpiece are shown in Fig.11- Fig.13, respectively. It is found that the strain rate increases with the decrease of scratching depth due to the decrease of shear angle caused by the increase of average negative rake angle, and the increase of average negative rake angle is due to the blunt round at the tip of grit. It is also found the plastic strain increases with the decrease of scratching depth, and the material temperature decreases with the decrease of the scratching depth. The strain rate, plastic strain and temperature together determine the flow stress of workpiece material according to the equation (9). So the material flow stress increases with the decrease of scratching depth that is material removal rate according to the above analysis. It means that more energy is consumed during the scratching process due to the increase of the flow stress when the scratching depth is small, which caused the size effect of specific cutting energy.
(a) Scratching depth =6μm |
(b) Scratching depth =8μm |
(c) Scratching depth =12μm |
(d) Scratching depth =16μm |
(e) Scratching depth =32μm |
(f) Scratching depth =40μm |
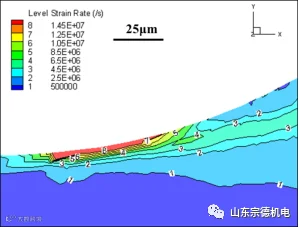
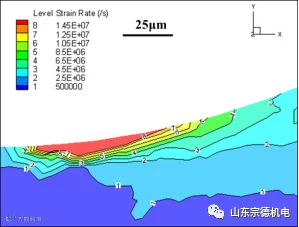
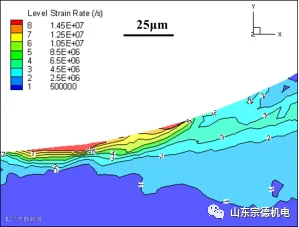
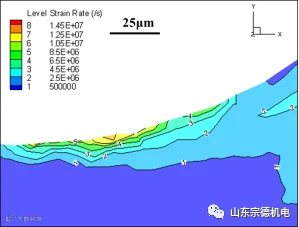
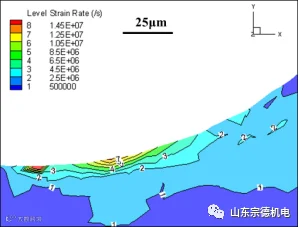
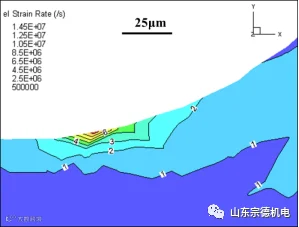
Fig.11 The simulation results of strain rate (Scratching velocity=30m/s )
(a) Scratching depth =6μm |
(b) Scratching depth =8μm |
(c) Scratching depth =12μm |
(d) Scratching depth =16μm |
(e) Scratching depth =32μm |
(f) Scratching depth =40μm |
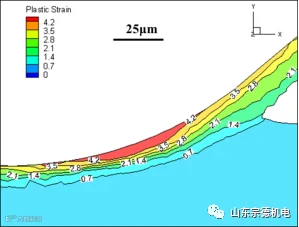
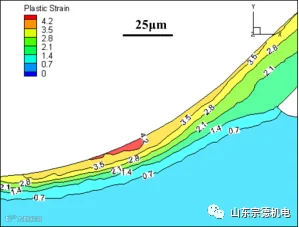
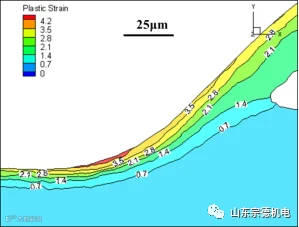
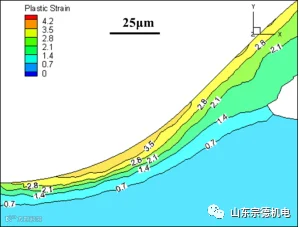
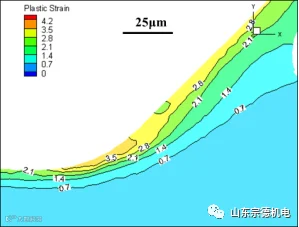
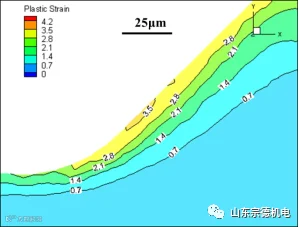
Fig.12 The simulation results of plastic strain (Scratching velocity=30m/s )
(a) Scratching depth =6μm |
(b) Scratching depth =8μm |
(c) Scratching depth =12μm |
(d) Scratching depth =16μm |
(e) Scratching depth =32μm |
(f) Scratching depth =40μm |
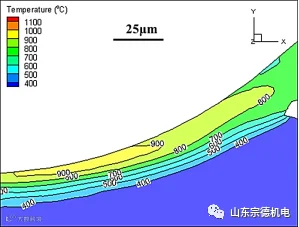
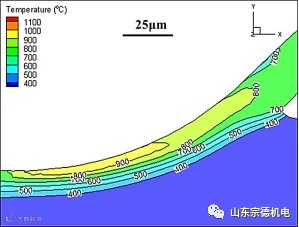
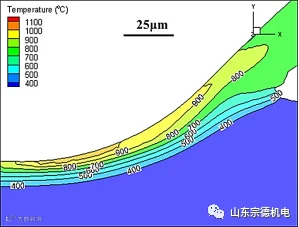
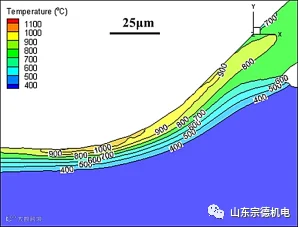
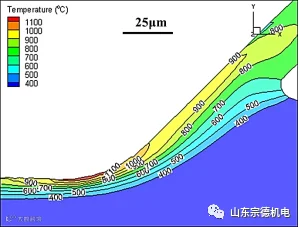
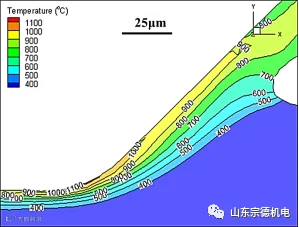
Fig.13 The simulation results of temperature (Scratching velocity=30m/s )
Material removal mechanisms of different scratching depth have different characteristics in terms of ploughing and cutting. Prominent action will be determined by using the measure of pile up ratio.as shown in Fig.14, the pile-up ratio is defined as the total pile-up area divided by groove section area, which is expressed as following eauqtion:
Where ρ is the pile-up ratio, AP is the total pile-up area, AG is the groove section area. The pile-up ratio for different scratching ratio is shown in Fig.15. It is found that the pile-up ratio decreases almost linearly with the increase of scratching depth, which could explain the size effect of specific cutting energy from another perspective.
Fig.14 cross section profile of scratch
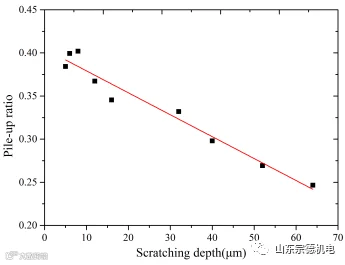
Fig.15 Pile-up ratio versus scratching depth
5. Conclusions
l A method of research on the size effect of the specific cutting energy based on the numerical simulation has been proposed. The theoretical model of the research on size effect of specific cutting energy using single grit scratching simulation was presented.
l A series of single grit scratching simulations with different scratching depths have been carried out, and the specific cutting energy was calculated based on the power consumed and the material removal rate. The relationship between the specific cutting energy and the material removal rate has been given which agrees well with that presented by Malkin.
l The conclusion has been got that the flow stress increases with the decrease of removal rate, which explains the relationship between specific cutting energy and material removal rate well.
l The pile-up ratio decreases almost linearly with the increase of scratching depth, which could explain the size effect of specific cutting energy from another perspective.
Acknowledgments
This study is funded by National Natural Science Foundation of China (No.51475173), Natural Science Foundation of Fujian Province, China(No. 2016J01237 ) and Graduate Innovation ability Development Program of Huaqiao University (No.17011080006).
References:
[1] M. Shaw, The size effect in metal cutting, Tran. ASME (1974) 671-691.
[2] S. Malkin, Minimum energy in abrasive processes, WEAR 32 (1975) 15-23.
[3] S. Malkin, C. Guo, Grinding technology -theory and application of machining with abrasives.2 ed., Indusry press, New York, 2008.
[4] S. Kannapan, S. Malkin, Effects of Grain Size and Operating Parameters on the Mechanics of Grinding, Trans. ASME, J. of Eng. for Ind (1972) 833.
[5] S. Malkin, T. Murray, Comparison of Single Point and Rotary Dressing of Grinding Wheels. 1977, pp. 278.
[6] S. Malkin, Specific Energy and Mechanisms in Abrasive Processes. 1975, pp. 453.
[7] X. Chen, T. Tecelli, Comparison of material removal characteristics in single and multiple cutting edge scratches, Advanced Materials Research 179 (2013) 189-195.
[8] Shear Stress in Metal Cutting, Journal of Engineering for Industry 92 (1970) 151.
[9] L. Bomin, Z. Bo, Modern grinding technologyMachinery Industry Press2003.
[10] W.B. Rowe, X. Chen, Characterization of the size effect in grinding and the sliced bread analogy, 35 (2010) 887-899.
[11] Y.H. Ren, B. Zhang, Z.X. Zhou, Specific energy in grinding of tungsten carbides of various grain sizes, CIRP Annals - Manufacturing Technology 58 (2009) 299-302.
[12] E. Brinksmeler, A. Glwerzew, Chip Formation Mechanisms in Grinding at Low Speeds, CIRP Annals - Manufacturing Technology 52 (2003) 253-258.
[13] H. Wang, G. Subhash, A. Chandra, Characteristics of single-grit rotating scratch with a conical tool on pure titanium, WEAR 249 (2001) 566-581.
[14] D. Zhu, S. Yan, B. Li, Single-grit modeling and simulation of crack initiation and propagation in SiC grinding using maximum undeformed chip thickness, COMPUTATIONAL MATERIALS SCIENCE 92 (2014) 13-21.
[15] N. Duan, Y. Yu, W. Wang, X. Xu, SPH and FE coupled 3D simulation of monocrystal SiC scratching by single diamond grit, International Journal of Refractory Metals & H... (2016).
[16] H.M. Pen, Y.C. Liang, X.C. Luo, Q.S. Bai, S. Goel, Multiscale simulation of nanometric cutting of single crystal copper and its experimental validation, COMPUTATIONAL MATERIALS SCIENCE (2011).
[17] T. Zhang, F. Jiang, L. Yan, X. Xu, Research on the Stress and Material Flow with Single Particle—Simulations and Experiments, Journal of Materials Engineering & Performance 26 (2017) 2689-2697.
[18] J. Yu, F. Jiang, Y. Rong, H. Xie, T. Suo, Numerical study the flow stress in the machining process, The International Journal of Advanced Manufacturing Technology 74 (2014) 509-517.