
摘要
随着我国城市化进程的不断推进,城市公共交通系统正朝着立体化、多元化的方向发展。城市公共交通枢纽作为各种交通方式的物理载体,其布局和运营效率直接影响到整个线网的畅通。有鉴于此,本文对常规公交枢纽进行了系统分析,建立了能有效反映常规公交枢纽系统的评价指标体系;然后,运用灰色关联分析理论对传统公交枢纽系统的运营效率进行了评价;最后,进行案例分析,计算出目标的综合评价值并进行排序。结果表明,人均换乘面积、停车设施率、换乘标志设施率和换乘信息及时性是积极的指标。本文的研究结果补充和完善了现有的公交枢纽分析模型。
1 Introduction
In recent years, countries all over the world are vigorously developing efficient, convenient and high-capacity public transportation, which has become one of the most effective ways to alleviate urban traffic congestion and advocate green and low-carbon transportation. Conventional public transportation system is the core part of urban public transportation. With the acceleration of urbanization in China, residents' travel mode choice and travel distance are increasing, and transfer has gradually become an important part of residents' travel. Therefore, the role of public transport transfer hub in the public transport network is becoming more and more significant, and the rationality of its location directly affects the operation efficiency and service quality of the whole urban public transport system. The research on the layout optimization of public transport hub has always been a hot topic in the field of transportation at home and abroad. Urban public transport transfer hub is a facility for centralized transfer of multiple (or multiple) urban public transport lines arranged in one place. Its function focuses on transfer. Therefore, the main difference between conventional public transport transfer hub and traditional public transport terminal station is the concentration of parking lot and vehicle servicing equipment [1]. However, in the planning and design of conventional public transport hub, the operation efficiency of transfer system is not fully considered. Therefore, it is necessary to make a comprehensive evaluation on the operation efficiency of the transfer system of the conventional public transport hub.
Throughout the domestic and international research on urban public transport hub, researchers have achieved a lot of remarkable research results. Yang et al. [2] proposes a two-stage optimization method for urban public transport hub layout. Firstly, the attractiveness of the urban public transport hub is evaluated from the accessibility of alternative points, the degree of bus line aggregation and the distribution range of public transport lines, and then the set of alternative hub points is determined. Based on the alternative hub set. Zhong et al. [3] took the integration of urban and rural public transportation as the background, regarded the urban public transportation hub and the key central town hub as a whole, and constructed a tree-star-star multi-level incomplete network. Wang et al. [4] discusses how to realize effective planning control from three aspects: ensuring appropriate traffic function, controlling reasonable development scale and selecting the best layout mode. Wang et al. [5] used IC card data-based methods to determine passenger flow for boarding, dropping off, and changing passengers, combined with actual IC card swiping data, to analyze the time characteristics, dynamic characteristics and short-term characteristics of passenger flow in the bus hub. Therefore, the bus transfer hub is a very complex system, so it is important to evaluate the reasonable and objective of the hub. Therefore, this paper uses the grey correlation method to evaluate the operation efficiency of urban transit transfer hub system, and tries to make the weight determination more direct and the result more direct.
2 Grey relational analysis theory and formula solution
2.1 Grey relational analysis theorem
Grey correlation analysis is a quantitative description and comparison method of the development and change of a system. Its basic idea is to determine whether the relationship is close by determining the geometric similarity of reference data columns and several comparative data columns, which reflects the degree of correlation between curves.
Grey system theory is a kind of system science theory, which was founded by Professor Deng Julong, a famous scholar. The grey correlation analysis is a method to judge the correlation degree between factors according to the similarity degree of geometry of curve of each factor change. This method through the quantitative analysis of the dynamic process development situation, completes the comparison of the geometric relations of the statistical data in the time series in the system, and obtains the gray correlation between the reference and the comparison series. The closer the development direction and speed of the comparison series with the higher the correlation degree of the reference series, the closer the relationship with the reference series. The grey correlation analysis method requires that the sample size can be as low as 4, and it is also applicable to the irregular data, and there will be no discrepancy between the quantitative results and the qualitative analysis results. The basic idea is to deal with the original observation of evaluation index dimensionless, calculate the correlation coefficient, correlation degree and sort the evaluation indexes according to the size of the correlation degree. The application of grey relevance degree involves various fields of social science and natural science, especially in the field of social economy, such as investment income of various sectors of national economy, analysis of regional economic advantages, adjustment of industrial structure, etc., which have achieved good application results.
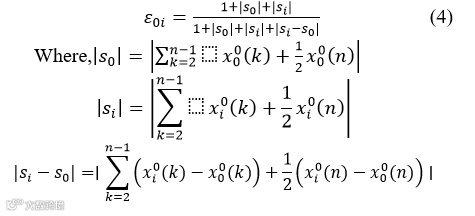
Correlation degree can be divided into absolute correlation degree and relative correlation degree. The absolute correlation degree is initially valued by the initial point zero method. When the analysis factors are quite different, the dimensional inconsistency between variables often affects the analysis, and it is difficult to get a reasonable result. The relative correlation degree is analyzed by relative quantity, and the calculation result is only related to the change rate of the sequence relative to the initial point, and has nothing to do with the size of each observation data, which makes up for the defect of absolute correlation degree to a certain extent [6].
For a given real number , if it satisfies:
(1)Normative
 (1)
(1)
(2) Integrity
 (2)
(2)
(3) Duality
 (3)
(3)
Then is called the gray correlation degree between
2.2 Grey correlation analysis and calculation
When the time intervals of the sequence factors are different, the isochronization of the factor sequence is to delete the excess data of a longer sequence or to fill in the insufficient data of the predicted sequence. This step is not necessary for the calculation of the same time interval of the factor sequence.
Grey absolute correlation:
3 Construct an Index System
Constructing the index system for evaluating the operation efficiency of the transfer system is to provide decision-making basis for relevant service objects. For different service objects, the expected indicators are different. We should not only obtain information from the micro level, but also grasp it from the macro level; There is not only the demand for real-time dynamic information of hub station, but also the demand for fixed static information of station traffic. Single index cannot reflect the effectiveness of the system, but it needs to use multi-level and multi-directional index system to meet the standards of different users. It mainly meets the following principles:
1) Scientific principle. The evaluation index system must accurately and objectively describe the infrastructure level, operation and service status, and the progress of information platform construction of public transport transfer hub.
2) The principle of comparability. The indicators should be comparable, and be able to calibrate and quantify the relevant indicators. For non qualitative indicators, there should be evaluation criteria and standards that can be compared.
3) Reliability principle. Indicators must be clearly defined, simple and practical.
4) The principle of coordination. Because the indicators of the system are not single, the indicators should be compatible, and there should be no contradictory paradoxes.
Based on the field survey and measurement of urban public transport transfer system, the index system for evaluating its operation efficiency is constructed, as shown in Figure 1.
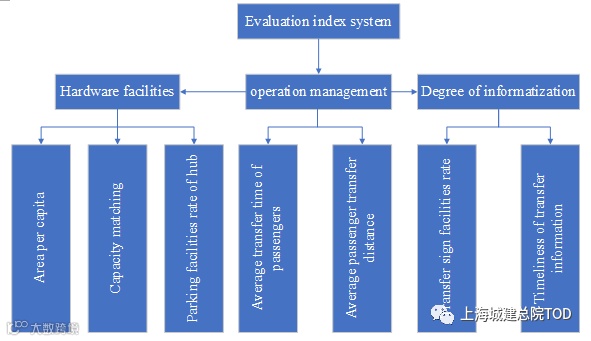
Fig. 1. Evaluation index system.
3.1 Hardware facilities
The per capita transfer facilities are S. The per capita area of transfer facilities can reflect the capacity of transfer facilities to accommodate passenger flow. This indicator reflects the degree of congestion and comfort of passenger transfers. If the indicator is too large, it will not only cause a waste of resources but also increase the transfer time; if it is too small, it will easily cause congestion.
3.2 Operational management
The average transfer time T of passengers. The average transfer time of passengers refers to the average time required for passengers to transfer in the bus interchange hub, which is mainly composed of walking time, waiting time, and ticket-buying queue time, reflecting the time it takes for passengers to complete the entire behavior. The average transfer distance of passengers is L. The average transfer distance of passengers refers to the average walking distance for passengers to complete the entire transfer process.
3.3 degree of information
The transfer sign setting rate V. Reasonable transfer signs can provide passengers with accurate transfer information in time. The setting rate of transfer signs refers to the ratio between the number of existing transfer signs and the number of transfer signs that need to be installed in the city's public interchange hub. This indicator reflects the degree of informatization of the transfer.
4 Analysis of Calculation Examples
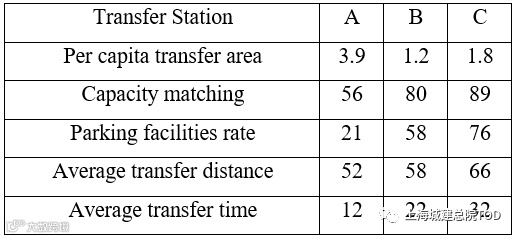
Using the measured data of the project "Research on the integration and comprehensive analysis system of highway traffic information resources" in Sichuan Province, this paper mainly obtains the required index parameters through field measurement and relevant data statistics. Taking three bus stations in Chengdu as the evaluation objects of bus transfer hub, the initial values of each evaluation index are obtained through the project text data, as shown in Table 1.
Table 1. Initial value of evaluation index.
After dimensionless treatment of indicators, according to the above formula, the weight values and correlation degree of each index can be obtained as shown in Figure 2-6.
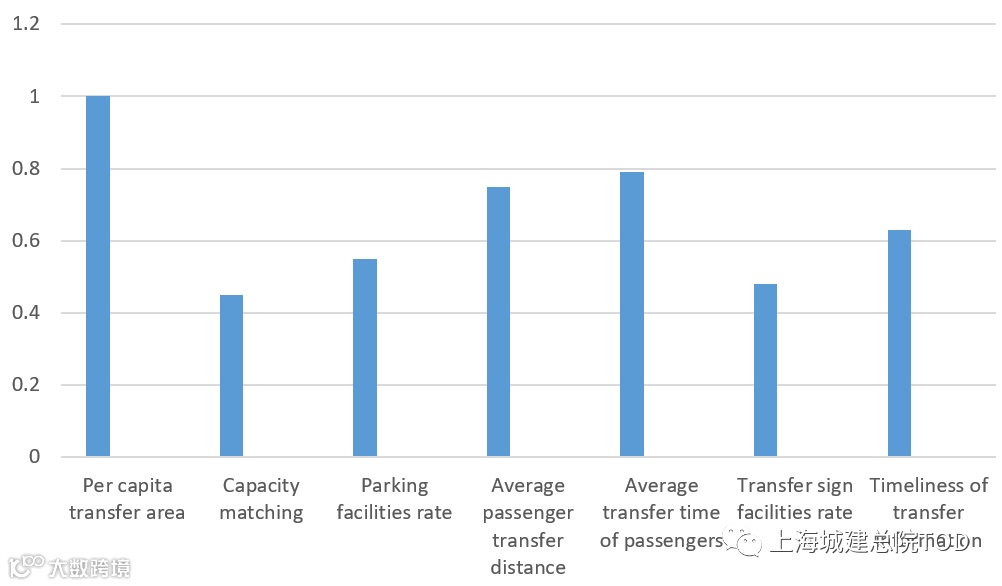
Fig. 2. Correlation degree of per capita transfer area.

Fig. 3. Transport capacity matching degree correlation degree.

Fig. 4. Parking facilities rate correlation.
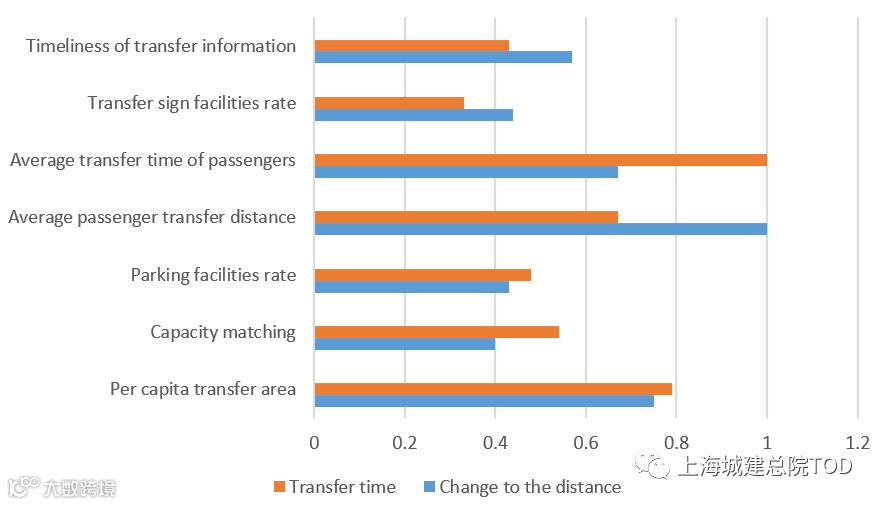
Fig. 5. Average passenger transfer index correlation degree.

Fig. 6. Weight of each evaluation index.
Per capita transfer area, parking facilities rate, transfer sign facilities rate and transfer information timeliness are positive indicators, and the rest are negative indicators. Finally, the evaluation value, comprehensive value and ranking of each evaluation object under each index are calculated, as shown in Table 2.
Table 2. Evaluation value and comprehensive value of each evaluation index.

Based on the analysis of the urban public transport transfer hub system, the quantitative and qualitative indicators which can accurately reflect the operation efficiency of the transfer system are selected. The comprehensive evaluation value and ranking of the objects can be calculated by using the grey correlation degree weighted evaluation model. In the process of calculating the index weight, the per capita transfer area and the timeliness of transfer information are more important indicators. In the analysis of the example, it can be seen that A station has the highest comprehensive ranking, and B station has the lowest comprehensive evaluation value.
5 Conclusion
Public transport system is an important part of urban public transport in China, and the efficiency of bus transfer hub greatly affects the function of the conventional public transport system. Therefore, this paper proposes the index system to evaluate the operation efficiency of urban public transport hub from the qualitative and quantitative perspectives, and establishes the evaluation model by using the grey correlation analysis theory. The model can determine the main factors which influence the large by factor sequence, avoid the interference of subjective factors, and make the evaluation results more objective, scientific and operable. This evaluation method is of great value in the efficiency of urban transit transfer hub.
References
1. Feng, S.H., Li, S.Q., Xie, X.Z. (2011) Capacity of Pedestrian Crosswalk at Intersection. Journal of Transport Information and Safety, 01:20-24.
2.Wang, Y.P., Zong, Y.Z., Yang, S.Y. (2019) Analysis of passenger flow characteristics of public transport hub based on IC Card. Journal of Shandong University of Technology (Natural Science Edition), 03:49-55+65.
3.Zhong, W., Juan, Z.C., Sun, B.F. (2018) Hierarchical Hub Location Model for Integration of Urban and Rural Public Transport in an Incomplete Network. Journal of Jilin University (Engineering and Technology Edition), 05: 1387-1397.
4.Yang, Y., Yu, B., Kong, L., Sun, R.P., Yang, Z.Z. (2013) Urban Transit Hub Location Optimization Based on Attractiveness. Systems Engineering-Theory and Practice, 09 : 2422-2429.
5.Wang,F.,Ye,Q.,Dai,S.,Ma, L. (2011) Comprehensive Development for Bus Interchange Terminal:A Case Study in Wusheng Road Bus Terminal Improvement in Wuhan. South China University of Technology, 06 : 43-49.
6.Long, J.L. (2002) Grey theory basis. Huazhong University of science and Technology Press, Wu Han.